Download
1 / 21
210 likes | 216 Views
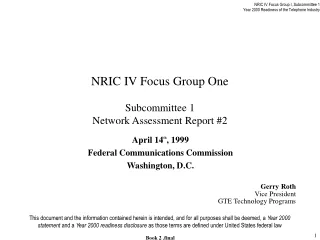
NRIC Focus Group One Subcommittee 1 Network Assessment. January 14, 1999 Gerry Roth Vice President GTE Technology Programs.

E N D
NRIC Focus Group OneSubcommittee 1Network Assessment January 14, 1999 Gerry Roth Vice President GTE Technology Programs This document and the information contained herein is intended, and for all purposes shall be deemed, a Year 2000 statement and a Year 2000 readiness disclosure as those terms are defined under United States federal law
Scope of Effort • Provide assessment of Year 2000 compliance of Public Switch Telephone Network (PSTN) • Participants: • 7 Large Local Exchange Carriers (LEC) 98.5% • 22 Medium to Small Local Exchange Carriers .5% • 3 Large Inter-Exchange Carriers (IXC) 82.0% • For addition in April following FCC questionnaire • Wireless • Cable • Satellite • International Assessment • Presentation by relative risk and potential impact of Year 2000 non-compliance • Risk to U.S. ranked by traffic volume • Methodology • Direct query of Large Local Exchange Carrier and Inter-Exchange Carrier Participants in November • September 1998 and December 1998 (estimates) • Indirect query of medium and small Local Exchange Carriers • September 1998 only • International • 6 data sources--risk assessments weighted and combined • Correlation to 1997 international calling patterns from/to the U.S.
Participating Local Exchange Carriers & Inter-Exchange CarriersIndustry Coverage Coverage by Participating Local Exchange Carriers (as a percentage of Total U.S. Access Lines) Coverage by Participating Inter-Exchange Carriers (as a percentage of 1997 Total IXC Revenue) Others 1% Others 18% Participating Companies 99% Participating Companies 82% Total 95.1B Participating 78.3B Total 193.6M Participating 190M
Participating Companies Others Y2K AssessmentCoverage by Participating Carriers
100% 94% 90% 84% 80% 71% 70% 62% 60% 54% 50% 47% 50% 39% 40% 30% 20% 10% 0% Large Companies Midsize and Small Companies Y2K Lifecycle Compliance StatusLarge and Medium Size Local Exchange Carriers September 30, 1998 Awareness Renovation Validation Implementation
100% 90% 80% 73% 70% 65% 63% 64% 62% 60% 60% 50% 40% 30% 20% 10% 0% Y2K U.S. Public Switched Telephone Network Compliance StatusLarge and Medium Size Local Exchange Carriers September 30, 1998 % Switches Y2K Ready % Non-Switch Network Components Y2K Ready % Network & IS Applications Y2K Ready Large Companies Midsize and Small Companies
98% 100% 94% 86% 90% 81% 80% 74% 71% 70% 62% 60% 54% 50% 40% 30% 20% 10% 0% September 30, 1998 December 31, 1998 Awareness Renovation Validation Implementation Y2K Lifecycle Compliance StatusRate of ChangeLarge Local Exchange Carriers September - December 1998
September 30, 1998 December 31, 1998 Large Local Exchange Carrier Compliance StatusRate of Change September - December 1998 100% 90% 85% 86% 79% 80% 73% 70% 64% 63% 60% 50% 40% 30% 20% 10% 0% % Switches Y2K Ready % Non-Switch Network Components Y2K Ready % Network & IS Applications Y2K Ready
100% 90% 84% 84% 80% 74% 70% 60% 50% 40% 30% 20% 10% 0% Public Switched Telephone Network Y2K Readiness Major Inter-Exchange Carriers December 31, 1998 % Switches Y2K Ready % Non-Switch Network Components Y2K Ready % Network & IS Applications Y2K Ready
International Status by Region Perceptions of Risk 5.0 Low 4.0 Medium Regional Range of Responses Level of Risk 3.0 Regional Average Score High 2.0 1.0 Asia Pacific North America Sub Sahara Africa Middle East & North Africa (not Israel) Indian sub continent Eastern Europe (inc. Russia) Western Europe (inc. Cent & South America Israel) The scores blend such that the following score ranges apply: 4.1 - 5.0 = Low Risk 3.1 - 4.0 = Medium Risk 1.0 - 3.0 = High Risk; based on uncertainty
International Status by CountryPerceptions of Risk Level of Risk Bermuda Panama USA UK Low Netherlands Hong Kong Australia 5.0 Singapore Canada Ireland Spain Peru Caribbean Is. New Zealand Switzerland Portugal Sweden Belgium Norway France Bahrain Chile Finland Taiwan Czech Rep Bulgaria Austria Poland U.A.E. Sudan Germany Malaysia Hungary Japan Fiji South Africa 4.0 Italy Puerto Rico Denmark Pakistan Thailand Jordan Turkey Israel So. Korea Mozambique Indonesia Brazil Russia India Medium Argentina Chad Venezuela Mexico 3.0 Philippines Lithuania Zimbabwe China Cambodia Sri Lanka Yugoslavia No. Korea Romania Morocco Kenya Uruguay Saudi Arabia Costa Rica Armenia Ecuador Ethiopia 2.0 The scores blend such that the following score ranges apply: 4.1 - 5.0 = Low Risk 3.1 - 4.0 = Medium Risk 1.0 - 3.0 = High Risk; based on uncertainty Kuwait Nepal Bangladesh Afghanistan El Salvador Guatemala Columbia Vietnam Somalia Nigeria Egypt Zaire Laos High 1.0 0.0
Level of Risk Bermuda Panama USA UK Low Netherlands Hong Kong Australia 5.0 Singapore Canada Ireland Spain Peru Caribbean Is. New Zealand Switzerland Portugal Belgium Sweden Norway France Bahrain Chile Finland Taiwan Czech Rep Bulgaria Austria Poland U.A.E. Germany Sudan Malaysia Hungary Japan Fiji 4.0 South Africa Italy Puerto Rico Denmark Pakistan Thailand Turkey Jordan So. Korea Israel Mozambique Indonesia Brazil Russia India Medium Argentina Chad Venezuela Mexico 3.0 Philippines Lithuania Zimbabwe China Cambodia Sri Lanka Yugoslavia No. Korea Romania Morocco Kenya Uruguay Saudi Arabia Costa Rica Armenia Ecuador Ethiopia 2.0 The scores blend such that the following score ranges apply: 4.1 - 5.0 = Low Risk 3.1 - 4.0 = Medium Risk 1.0 - 3.0 = High Risk; based on uncertainty Kuwait Nepal Bangladesh Afghanistan El Salvador Guatemala Columbia Vietnam Somalia Nigeria Egypt Zaire Laos High 1.0 High Medium Low Impact Impact Impact 0.0 Impact of Failure International Status by CountryPerceptions of Risk Impact
Level of Risk UK (1,716) Netherlands (246) Hong Kong (418) Australia (351) Singapore (151) Ireland (152) Spain (177) Peru (146) Switzerland (213) 5.0 Dominican Republic (508) Sweden (144) Belgium (139) France (544) Chile (111) Taiwan (380) Low Poland (165) Germany (953) South Africa (101) Japan (899) Italy (383) Thailand (119) Pakistan (116) So. Korea (460) Israel (285) 4.0 Brazil (385) Russia (105) India (337) The Bahamas (102) Argentina (189) Venezuela (177) Medium Philippines (338) Trinidad & Tobago (101) Greece (117) 3.0 China (283) Jamaica (231) Saudi Arabia (112) Ecuador (146) 2.0 El Salvador (144) Guatemala (129) Columbia (316) High 1.0 Major Interest Significant Interest > 200M Minutes Between 200M - 100M Minutes 0.0 Millions of Minutes Country Name (Millions of Minutes) Countries of Major and Significant Interest to the U.S.(as determined by Intercontinental Traffic Patterns, sorted by Perceived Risk) * Minutes of use from 1995 Data (Source: ING Barings - Telecommunications Map of the World, 2nd Edition, September 1997)
Y2K Risk to U.S. Intercontinental Traffic (determination of risk by country of originating / terminating traffic) High Risk 1645 mMitt* Medium Risk 4728 mMitt* 21% 36% 43% Low Risk 5599 mMitt* Source: Telecommunications Map of the World, 2nd Edition, September 1997 * mMiTT: million Minutes of Intercontinental Telecommunications Traffic
Year 2000 Assessment Conclusions • General • All participating companies are progressing at approximately the same rate • Small companies somewhat behind the larger ones • Progress to date is very encouraging • All participating companies on a trajectory for timely completion of PSTN • Results of this study become a good benchmark for non participating companies to follow • Local Exchange Carriers (LEC) • Participating LECs cover 99% of all switched access lines in U.S. • Small to medium companies lag large Local Exchange Carriers by 10-15% • All participating companies were better than 65% complete by September 1998 • December estimate at 76% • Readiness • All large companies projecting readiness complete June 30, 1999 • Medium and small LECs • 50% by end of 2nd Quarter 1999 • 32% by end of 3rd • 18% by end of 4th • Participating companies are 29/1300 = 99% of all access lines • 1271 companies constitute the remaining 1%
Conclusions • Inter-Exchange Carriers (IXC) • Participating IXCs represent 82% of inter-exchange market • Most network elements have been certified compliant and are being rolled out • Participating IXCs will be in a position to support the LEC completion date of June 30, 1999 • Major IXCs at 60% readiness or better as of September 1998 • December estimate at 81% • All IXCs project a June 30, 1999 readiness
Conclusions • International • North America, Asia Pacific, and Western Europe are medium to low risk • North East Asia, Middle East & North Africa, and Eastern Europe are medium to high risk • Central & South America, India & Subcontinent, Sub Sahara Africa are high risk • Regions and countries of most concern to U.S. identified • Regional impact of risk varies widely by country and telecom provider • Most information is based on perception of risk or is anecdotal -- based on inconsistent and unofficial information
Recommendations • Increase activity in Wireless assessment led by FCC • Map key U.S. Government installations nationwide to telecom compliance areas • U.S. Government engage in direct inquiry on Y2K status to countries determined essential to U.S. telecommunication traffic patterns • Work with the ITU, U.S. State Department, and others to accurately assess the true risk to the U.S. • Add the risk of methodology inconsistencies to perceived completeness of plans • Specifically test deficiencies • Effective quality programs • Assess results of this study with respect to other economic sectors to determine potential secondary risks and impacts
Recommendations • A more proactive role should be undertaken by the FCC (working the appropriate government offices) to support those countries requesting assistance from the ITU and World Bank and/or that have high telecommunications traffic with the U.S. • For countries whose Year 2000 readiness may be an issue to U.S. companies, we recommend that the FCC assign an International Contingency Planning Coordinator to support interested U.S. companies in their contingency planning around regions or specific countries that are perceived to be high Y2K risk
Summary • Public Switched Wireline and Long Distance Telephone Operations in the United States (and North America) appear to be on an appropriate path for Year 2000 compliant operations • More and better information is required for a complete global assessment, including wireless and cable operations • Lack of information in and of itself does not necessarily indicate lack of progress
Future Work • Marry FCC questionnaire results in NRIC sources for a more inclusive report • Update International data sources and measure their improvement • Re-question the LEC and IXC data sources for: • validation of December 1999 data • Actual data for February 1999 • Estimation targets for March 1999 • Increase Wireless participation and measure their network completion