Download
1 / 1
10 likes | 138 Views
Abstract

E N D
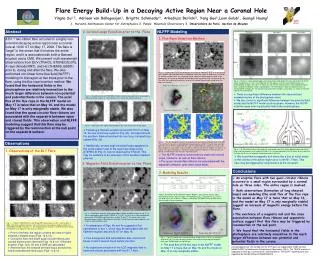
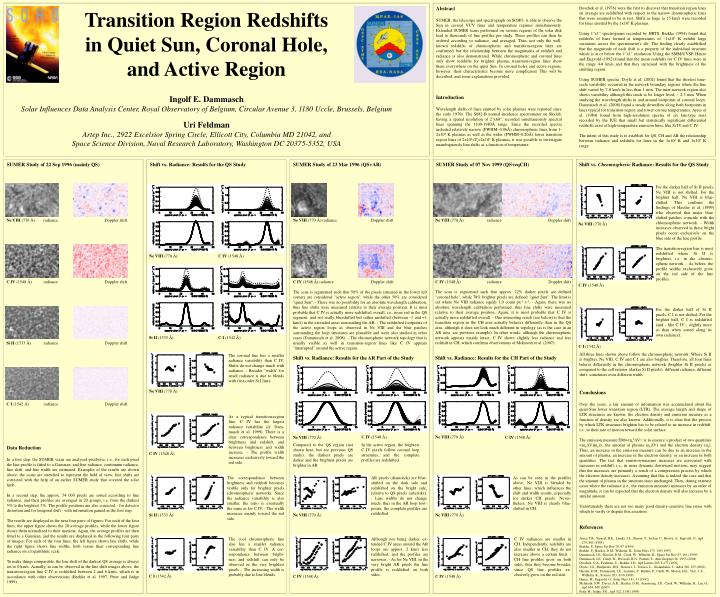
Abstract SUMER, the telescope and spectrograph on SOHO, is able to observe the Sun in several VUV lines and temperature regimes simultaneously. Extended SUMER scans performed on various regions of the solar disk lead to thousands of line profiles per study. These profiles can then be ordered according to radiance, and averaged. Thus, not only the well-known redshifts of chromospheric and transition-region lines are confirmed, but the relationship between the magnitudes of redshift and radiance is also demonstrated. While chromospheric and coronal lines only show redshifts for brighter plasma, transition-region lines show them everywhere on the quiet Sun. In coronal holes and active regions, however, their characteristics become more complicated. This will be described, and some explanations provided. Introduction Wavelength shifts of lines emitted by solar plasmas were reported since the early 1970s. The S082-B normal-incidence spectrometer on Skylab, having a spatial resolution of 2"x60", recorded simultaneously spectral lines spanning the 1100-1980Å range. Since the recorded spectra included relatively narrow (FWHM~0.06Å) chromospheric lines from 1-2x10⁴ K plasmas as well as the wider (FWHM~0.20Å) lower transition region lines of 2x10⁴<Te<2x10⁵ K plasmas, it was possible to investigate unambiguously line shifts as a function of temperature. Doschek et al. (1976) were the first to discover that transition region lines on average are redshifted with respect to the narrow chromospheric lines that were assumed to be at rest. Shifts as large as 15 km/s were recorded for lines emitted by the 1x10⁵ K plasmas. Using 1"x1" spectrograms recorded by HRTS, Brekke (1994) found that redshifts of lines formed at temperatures of ~1x10⁵ K exhibit large variations across the spectrometer's slit. The finding clearly established that the magnitude of each shift is a property of the individual structure which is at or below the 1"x1" resolution. Using the SMM/UVSP, Henze and Engvold (1992) found that the mean redshifts for C IV lines were in the range 4-8 km/s and that they increased with the brightness of the emitting region. Using SUMER spectra, Doyle et al. (2002) found that the shortest time-scale variability occurred in the network boundary regions where the line shift varied by 7-8 km/s in less than 1 min. The inter-network region also shows variability although this tends to be longer lived, ~ 2-3 min. When studying the wavelength shifts in and around footpoints of coronal loops, Dammasch et al. (2008) found a steady downflow along both footpoints in lines typical for transition-region and lower-corona temperatures. Ayres et al. (1984) found from high-resolution spectra of six late-type stars recorded by the IUE that small but statistically significant differential redshifts exist of high-temperature emission lines, like Si IV and C IV. The intent of this study is to establish for QS, CH and AR the relationship between radiance and redshifts for lines in the 1x10⁴ K and 1x10⁵ K range. Transition Region Redshifts in Quiet Sun, Coronal Hole, and Active Region Ingolf E. Dammasch Solar Influences Data Analysis Center, Royal Observatory of Belgium, Circular Avenue 3, 1180 Uccle, Brussels, Belgium Uri Feldman Artep Inc., 2922 Excelsior Spring Circle, Ellicott City, Columbia MD 21042, and Space Science Division, Naval Research Laboratory, Washington DC 20375-5352, USA SUMER Study of 22 Sep 1996 (mainly QS) Shift vs. Radiance: Results for the QS Study SUMER Study of 23 Mar 1996 (QS+AR) SUMER Study of 07 Nov 1999 (QS+eqCH) Shift vs. Chromospheric Radiance: Results for the QS Study For the darker half of Si II pixels, Ne VIII is not shifted. For the brighter half, Ne VIII is blue-shifted. This confirms the findings of Hassler et al. (1999) who observed that major blue-shifted patches coincide with the chromospheric network. - Width increases observed in these bright pixels occur exclusively on the blue side of the line profile. Ne VIII (770 Å) radiance Doppler shift Ne VIII (770 Å) radiance Doppler shift Ne VIII (770 Å) radiance Doppler shift Ne VIII (770 Å) The transition-region line is most redshifted where Si II is brightest, i.e. in the chromo-spheric network. - As before, the profile widths exclusively grow on the red side of the line profiles. Ne VIII (770 Å) C IV (1548 Å) C IV (1548 Å) radiance Doppler shift C IV (1548 Å) radiance Doppler shift C IV (1548 Å) radiance Doppler shift C IV (1548 Å) The scan is segmented such that approx. 22% darker pixels are defined "coronal hole", while 78% brighter pixels are defined "quiet Sun". The limit is set where Ne VIII radiance equals 1.0 count px-1 s-1. - Again, there was no absolute wavelength calibration performed, thus line shifts were measured relative to their average position. Again, it is most probable that C IV is actually more redshifted overall. - One interesting result (see below) is that the transition region in the CH area actually behaves differently than in the QS area, although it does not look much different in topology (as is the case in an AR area, see previous example). In other words, although the chromospheric network appears mainly intact, C IV shows slightly less radiance and less redshift in CH, which confirms observations of McIntosh et al. (2007). The scan is segmented such that 50% of the pixels (situated in the lower left corner) are considered "active region", while the other 50% are considered "quiet Sun". - There was no possibility for an absolute wavelength calibration, thus line shifts were measured relative to their average position. It is most probable that C IV is actually more redshifted overall, i.e., more red in the QS segment, and not really blueshifted but rather unshifted (between -1 and +1 km/s) in the extended areas surrounding the AR. - The redshifted footpoints of the active region loops as observed in Ne VIII and the blue patches surrounding the loop structures are plausible and were also studied in other cases (Dammasch et al. 2008). - The chromospheric network topology that is usually visible as well in transition-region lines like C IV appears "interrupted" around the active region. For the darker half of Si II pixels, C I is not shifted. For the brighter half, C I is redshifted (and - like C IV - slightly more so than when sorted along its own radiance). C I (1542 Å) Si II (1533 Å) Si II (1533 Å) radiance Doppler shift C I (1542 Å) All three lines shown above follow the chromospheric network: Where Si II is brighter, Ne VIII, C IV and C I are also brighter. Therefore, all four lines behave differently in the chromospheric network (brighter Si II pixels) as compared to the cell interior (darker Si II pixels): different radiance, different shift, sometimes even different width. Conclusions Over the years, a fair amount of information was accumulated about the quiet-Sun lower transition region (LTR). The average length and shape of LTR structures are known; the electron density and emission measure as a function of density are also known. Additionally, it is clear that the process by which LTR structures brighten has to be related to an increase in redshift, i.e., to their rate of motion toward the solar surface. The emission measure EM=<ne2ΔV> is in essence a product of two quantities <(neΔV)(ne)>, the amount of plasma (neΔV) and the electron density (ne). Thus, an increase in the emission measure can be due to an increase in the amount of plasma, an increase in the electron density, or an increase in both quantities. The fact that emission-measure increases are associated with increases in redshift, i.e., in more dynamic downward motions, may suggest that the increases are primarily a result of a compression process by which the electron density increases. Assuming that this is indeed the case and that the amount of plasma in the structure stays unchanged: Then, during extreme cases where the radiance (i.e., the emission measure) increases by an order of magnitude, it can be expected that the electron density will also increase by a similar amount. Unfortunately there are not too many good density-sensitive line ratios with which to verify or dispute this assertion. References Ayres, T.R., Stencel, R.E., Linsky, J.L., Simon, T., Jordan, C., Brown, A., Engvold, O., ApJ 274, 801 (1984) Brekke, P., Space Sci Rev 70, 97 (1994) Brekke, P., Hassler, D.M., Wilhelm, K., Solar Phys 175, 349 (1997) Dammasch, I.E., Hassler, D.M., Curdt, W., Wilhelm, K., Space Sci Rev 87, 161 (1999) Dammasch, I.E., Curdt, W., Dwivedi, B.N., Parenti, S., Ann Geophys 26, 2955 (2008) Doschek, G.A., Feldman, U., Bohlin, J.D., ApJ Letters 205, L177 (1976) Doyle, J.G., Madjarska, M.S., Roussev, I., Teriaca, L., Giannikakis, J., A&A 396, 255 (2002) Hassler, D.M., Dammasch, I.E., Lemaire, P., Brekke, P., Curdt, W., Mason, H.E., Vial, J.-C., Wilhelm, K., Science 283, 810 (1999) Henze, W., Engvold, O., Solar Phys 141, 51 (1992) McIntosh, S.W., Davey, A.R., Hassler, D.M., Armstrong, J.D., Curdt, W., Wilhelm, K., Lin, G., ApJ 654, 650 (2007) Peter, H., Judge, P.G., ApJ 522, 1148 (1999) The coronal line has a smaller radiance variability than C IV. Shifts do not change much with radiance. - Broader "width" for small radiance is due to blends with first-order Si I lines. Shift vs. Radiance: Results for the AR Part of the Study Shift vs. Radiance: Results for the CH Part of the Study Ne VIII (770 Å) C I (1542 Å) radiance Doppler shift As a typical transition-region line, C IV has the largest radiance variability (cf. Dam-masch et al. 1999). There is a clear correspondence between brightness and redshift, and between brightness and width increase. - The profile width increases exclusively toward the red side. C IV (1548 Å) Ne VIII (770 Å) Ne VIII (770 Å) C IV (1548 Å) In the active region, the brightest C IV pixels follow coronal loop structures, and the complete profiles are redshifted. Compared to the QS region (not shown here, but see previous QS study), the darkest pixels are darker and the brightest pixels are brighter in AR. Data Reduction In a first step, the SUMER scans are analysed pixelwise, i.e., for each pixel the line profile is fitted to a Gaussian, and line radiance, continuum radiance, line shift, and line width are estimated. Examples of the results are shown above; the scans are stretched to represent the field of view; line shifts are corrected with the help of an earlier SUMER study that covered the solar limb. In a second step, the approx. 54 000 pixels are sorted according to line radiance, and their profiles are averaged in 20 groups, i.e. from the darkest 5% to the brightest 5%. The profile positions are also corrected - for detector distortion and for temporal drift - with information gained in the first step. The results are displayed in the next four pairs of figures: For each of the four lines, the upper figure shows the 20 average profiles, while the lower figure shows them normalized to their maxima. Again, the average profiles are then fitted to a Gaussian, and the results are displayed in the following four pairs of images: For each of the four lines, the left figure shows line shifts, while the right figure shows line widths, both versus their corresponding line radiance on a logarithmic scale. To make things comparable, the line shift of the darkest QS average is always set to 0 km/s. Actually, as can be observed in the line shift images above, the transition-region line C IV is redshifted between 2 and 6 km/s, which is in accordance with other observations (Brekke et al. 1997, Peter and Judge 1999). C IV (1548 Å) The correspondence between brightness and redshift becomes visible only for brighter pixels (chromospheric network). Since the radiance variability is also smaller, the ratio is eventually the same as for C IV. - The width increases mainly toward the red side. AR pixels (diamonds) are blue-shifted on the dark side and redshifted on the bright side, relative to QS pixels (asterisks). - Line widths do not change much, thus in the AR loop foot-points, the complete profiles are redshifted. As can be seen in the profiles above, Ne VIII is blended by other lines, which influences the shift and width results, especially for darker CH pixels. Never-theless, Ne VIII is clearly blue-shifted in CH. Si II (1533 Å) Ne VIII (770 Å) Ne VIII (770 Å) The cool chromospheric line also has a smaller radiance variability than C IV. A cor-respondence between bright-ness and redshift can only be observed in the very brightest pixels. - The increasing width is probably due to line blends. Although not being darker, ex-tended C IV areas around the AR loops are approx. 2 km/s less redshifted, and the profiles are narrower. - As for Ne VIII, in the very bright AR pixels the line profile is redshifted on both sides. C IV radiances are smaller in CH. Independently, redshifts are also smaller in CH, they do not increase above a certain limit. - CH line profiles grow on both sides, thus they become broader, since QS line profiles ex-clusively grow on the red side. C I (1542 Å) C IV (1548 Å) C IV (1548 Å)