Download
1 / 14
140 likes | 349 Views
Analyzing Heterogeneous Distributions: Multiple Regression Analysis. Analog to the ANOVA is restricted to a single categorical between studies variable. What if you are interested in a continuous variable or multiple between study variables? Weighted Multiple Regression Analysis

E N D
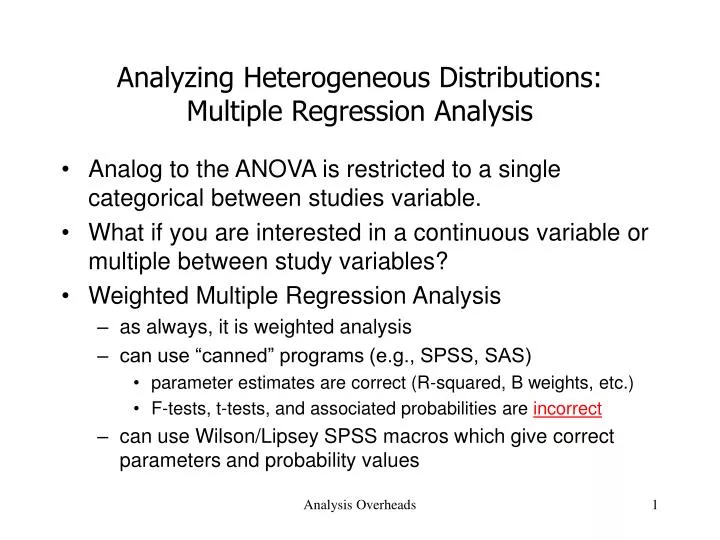
Analyzing Heterogeneous Distributions:Multiple Regression Analysis • Analog to the ANOVA is restricted to a single categorical between studies variable. • What if you are interested in a continuous variable or multiple between study variables? • Weighted Multiple Regression Analysis • as always, it is weighted analysis • can use “canned” programs (e.g., SPSS, SAS) • parameter estimates are correct (R-squared, B weights, etc.) • F-tests, t-tests, and associated probabilities are incorrect • can use Wilson/Lipsey SPSS macros which give correct parameters and probability values Analysis Overheads
Meta-Analytic Multiple Regression ResultsFrom the Wilson/Lipsey SPSS Macro(data set with 39 ESs) ***** Meta-Analytic Generalized OLS Regression ***** ------- Homogeneity Analysis ------- Q df p Model 104.9704 3.0000 .0000 Residual 424.6276 34.0000 .0000 ------- Regression Coefficients ------- B SE -95% CI +95% CI Z P Beta Constant -.7782 .0925 -.9595 -.5970 -8.4170 .0000 .0000 RANDOM .0786 .0215 .0364 .1207 3.6548 .0003 .1696 TXVAR1 .5065 .0753 .3590 .6541 6.7285 .0000 .2933 TXVAR2 .1641 .0231 .1188 .2094 7.1036 .0000 .3298 Partition of total Q into variance explained by the regression “model” and the variance left over (“residual” ). Interpretation is the same as will ordinal multiple regression analysis. If residual Q is significant, fit a mixed effects model. Analysis Overheads
Review of WeightedMultiple Regression Analysis • Analysis is weighted. • Q for the model indicates if the regression model explains a significant portion of the variability across effect sizes. • Q for the residual indicates if the remaining variability across effect sizes is homogeneous. • If using a “canned” regression program, must correct the probability values (see manuscript for details). Analysis Overheads
Random Effects Models • Don’t panic! • It sounds far worse than it is. • Three reasons to use a random effects model • Total Q is significant and you assume that the excess variability across effect sizes derives from random differences across studies (sources you cannot identify or measure). • The Q within from an Analog to the ANOVA is significant. • The Q residual from a Weighted Multiple Regression analysis is significant. Analysis Overheads
The Logic of aRandom Effects Model • Fixed effects model assumes that all of the variability between effect sizes is due to sampling error. • Random effects model assumes that the variability between effect sizes is due to sampling error plus variability in the population of effects (unique differences in the set of true population effect sizes). Analysis Overheads
The Basic Procedure of aRandom Effects Model • Fixed effects model weights each study by the inverse of the sampling variance. • Random effects model weights each study by the inverse of the sampling variance plus a constant that represents the variability across the population effects. This is the random effects variance component. Analysis Overheads
How To Estimate the RandomEffects Variance Component • The random effects variance component is based on Q. • The formula is: Analysis Overheads
Calculation of the RandomEffects Variance Component • Calculate a new variable that is the w squared. • Sum new variable. Analysis Overheads
Calculation of the RandomEffects Variance Component • The total Q for this data was 14.76 • k is the number of effect sizes (10) • The sum of w = 269.96 • The sum of w2 = 12,928.21 Analysis Overheads
Rerun Analysis with NewInverse Variance Weight • Add the random effects variance component to the variance associated with each ES. • Calculate a new weight. • Rerun analysis. • Congratulations! You have just performed a very complex statistical analysis. Analysis Overheads
Random Effects Variance Componentfor the Analog to the ANOVA andRegression Analysis • The Q between or Q residual replaces the Q total in the formula. • Denominator gets a little more complex and relies on matrix algebra. However, the logic is the same. • SPSS macros perform the calculation for you. Analysis Overheads
SPSS Macro Output with Random EffectsVariance Component ------- Homogeneity Analysis ------- Q df p Model 104.9704 3.0000 .0000 Residual 424.6276 34.0000 .0000 ------- Regression Coefficients ------- B SE -95% CI +95% CI Z P Beta Constant -.7782 .0925 -.9595 -.5970 -8.4170 .0000 .0000 RANDOM .0786 .0215 .0364 .1207 3.6548 .0003 .1696 TXVAR1 .5065 .0753 .3590 .6541 6.7285 .0000 .2933 TXVAR2 .1641 .0231 .1188 .2094 7.1036 .0000 .3298 ------- Estimated Random Effects Variance Component ------- v = .04715 Not included in above model which is a fixed effects model Random effects variance component based on the residual Q. Add this value to each ES variance (SE squared) and recalculate w. Rerun analysis with the new w. Analysis Overheads
Comparison of Random Effect with Fixed Effect Results • The biggest difference you will notice is in the significance levels and confidence intervals. • Confidence intervals will get bigger. • Effects that were significant under a fixed effect model may no longer be significant. • Random effects models are therefore more conservative. Analysis Overheads
Review of Meta-Analytic Data Analysis • Transformations, Adjustments and Outliers • The Inverse Variance Weight • The Mean Effect Size and Associated Statistics • Homogeneity Analysis • Fixed Effects Analysis of Heterogeneous Distributions • Fixed Effects Analog to the one-way ANOVA • Fixed Effects Regression Analysis • Random Effects Analysis of Heterogeneous Distributions • Mean Random Effects ES and Associated Statistics • Random Effects Analog to the one-way ANOVA • Random Effects Regression Analysis Analysis Overheads