Download
1 / 88
880 likes | 1.05k Views
World Population. Issues & Challenges for the 21 st century. “Imagine all the people, sharing all the world” John Lennon, “Imagine”. There are at least three more people in the world now than there were when you began reading this sentence. Just imagine. When and where were you born?

E N D
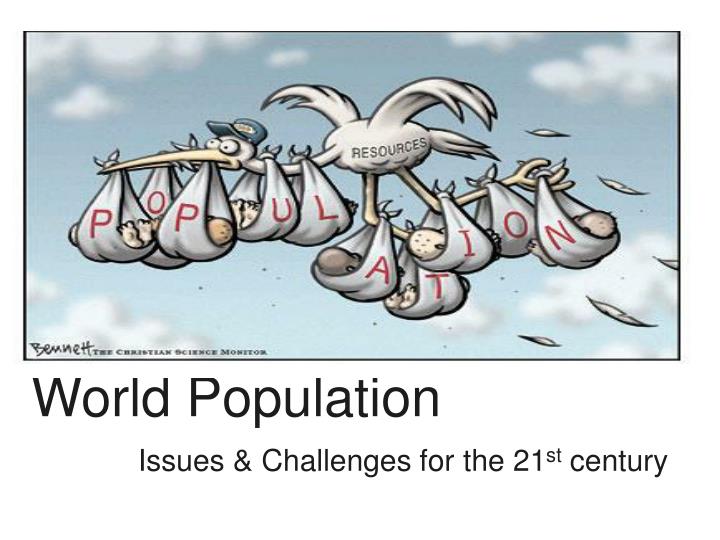
WorldPopulation Issues& Challenges for the 21st century
“Imagine all the people, sharing all the world” John Lennon, “Imagine”
There are at least three more people in the world now than there were when you began reading this sentence. Just imagine.
When and where were you born? • How many babies were born the same year? • What is your probability of getting married or divorced? • Do you plan to havechildren? How many?
What kind of job will you have? How often will you change jobs? When will you retire ? • How many times will you move, locally - or overseas? • How long will you live? What is likely to kill you?
POPULATION ISSUES 1a. FERTILITY, b. MORTALITY c. MIGRATION 2. SIZE AND GROWTH 3. COMPOSITION 4. DISTRIBUTION 5. GROWTH ISSUES 6. CONCERN ABOUT POPULATION 7. SINGAPORE
Why study population? • “…one factor more critical for security & growth in the 21st century is demography, not democracy. Burgeoning populations are a drag on developing countries, while perversely low fertility rates are slowing growth in developed societies. • The poor are making themselves poorer by over-producing themselves, and the rich will have a less dynamic society because they are not replacing themselves.” - MM Lee Kuan Yew, The geopolitics of babies, September 2005
Demography is defined as the study of human populations: - the size, composition and distribution - causes and consequences of changes in these characteristics
Populations are never static. They grow or decline through the interplay of 3 demographic processes: • Birth • Death • Migration • This lecture presents an overview of demographic processes; it traces pop trends and differences and examines broad social issues linked to pop change
1a.FERTILITY – 1st determinant of pop change • It refers to the no. of births that occur to an individual or in a population • In 2003,an average of 1.1 in Ukraine, 8.0 in Niger, 2.0 in US, 2.8 in the world • No. of babies born: 4m in US compared w 27m in India
1a. What factors affect fertility (number of births)? • Culture • Economics • Health
1a. Variables that explain nearly all the differences in fertility level among populations: • Age structure of pop • Status of women • % of women married • - average age at marriage • - mother’s age at birth of 1st child • Percent of women using contraception or contraception sterilization • Level of induced abortion
1a. Variables affecting fertility rates [contd] • Standard of living • - health standard -successful full-term pregnancies; public maternal & child care services e.g. immunization • - prevalence of diseases- e.g.STD that impair fertility • Education of girls, women working outside the home • Cultural ideas of family size
1a. • Fig 2 fr pg 9 - Age patterns of Fertility – Mali, US, Japan
“Fertility declines as the income and educational attainment of women increase.” Population Bulletin Dec 2005 • US data of 2000, for women 35-44: 1.4 children for graduate or professional women; 1.9 for women w high sch diplomas; 2.5 for those without high school diplomas.
1a. Measuring fertility • TFR • Concept of zero-replacement fertility – US: 2.1; Sierra Leone needs <3.0 • CBR / Crude Birth Rate – No. of babies born divided by mid-year pop, expressed as no.of babies per ‘000 pp. 2003: US14 per ‘000, 8 in Ukraine, 55 in Niger.
1b. MORTALITY- 2nd component of pop change • See Fig 3 pg10 • LIFE EXPECTANCY at birth • – L.E. is better gauge of the life chances of individuals in a pop • - L.E. is affected by biological and social factors. • In 2001, US 77, Japan 81, Botswana 37, Mozambique 34
1b. Mortality [contd] • Life Expectancy reflects the real life conditions in a pop • Better personal hygiene and public health practices • Diff btw more developed and less developed countries can be attributed to preventable diseases that strike children hard • If adequate health services were available throughout less developed world, mortality wd drop rapidly.
1b. • HIV / Aids epidemic caused L.E. to drop in several African c’tries, • Modern life favours spread of communicable diseases • Natural disasters, widespread violence • In less-developed areas of world, wars and natural disasters claim most lives bec of bad living conditions and emergency systems
1b. How do we explain differntials in L.E. • AGE - [15-24! Death by injuries, motor vehicle crashes]; M 3x that of F • Gender – women’s genetic, social, behavioural factors • Socioeconomic status - • ethnicity, • religion, • genetic factors
Waves of migration – legal and illegal throughout history • Reasons – “push-pull” process [seeking political asylum, employment etc] • Devt of cosmopolitan or ‘Melting Pot’ or plural or multiethnic, multicultural societies • In 2003, involuntary refugees or asylees number about 20 m, acc to UNHCR
Consequences of Migration • Diaspora - cultural enclaves, ‘Chinatown, Little Saigon, Italian quarter • Discrimination, language problems, unemployment, loss of support network • Pressure to conform, be assimilated, insecurity about losing own identity & culture, clinging on to roots, religion • Gradual loss of cultural identity with ygr generation adapting; tension within families
Brain Drain or Foreign talent ? When educated and highly skilled pp emigrate to a new country, the home country loses their potential social and economic contribution – after investing in their education and devt. Big problem for less devd countries; devt is undermined e.g. Philippines Possibility of reverse flow w economic and technological change – e.g return of Indian IT engineers & entrepreneurs fr Silicon Valley to Bangalore
2. Population size and growth • Whether a population grows or decreases, the changes can be traced to the net effects of fertility, mortality and migration: • Birth rate – Death rate • + rate of net migration • Rate of growth can be used to calculate a pop’s hypothetical doubling time [if rate remains constant] • World pop growing at 1.3 % per yr; 2003 births exceed deaths by 81m • UN projected world pop in 2050 will be 8.9b
2. Pop size and growth [contd] • China is world’s most populous nation w 1.3b [2003], increasing by 0.6% per yr • India has 1.1b but growth rate of 1.7 so likely to be most populous cty in mid 21st C • Fastest growing countries in M.East and Africa. Yemen, 19.4m [2003], w 3.3% growth rate will double in 21 yrs; African continent growing at 2.5% so will double in 28 yrs. • In 2003, deaths exceed births in 17 European cts []; net immigration provides only pop growth • Western Europe needs 1.1m immigrants a yr above current level - to keep working age pop stable
3. Population Composition – age and shape of societies • See pop pyramids of Mali, US & Italy 2000 • Pop pyramids tell us ? What do data on Age, Sex and Race & Ethnicity composition tell us of past and present, future needs, problems? • What is the impact on social, political, economic, cultural aspects of country?
4.Population Distribution • In 2003, 81% of world pop lived in the less developed regions of the world • Projection for 2050: 86% living in less devd regions • Within less devd regions explosive urban growth – overwhelming public services, housing and no. of available jobs.
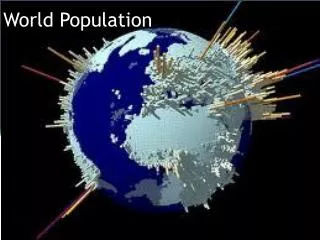
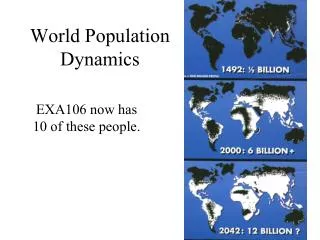
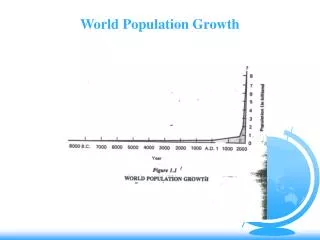
World Population Overview • There have never been as many people on earth as there are now (6.5 billion, 2005)
5.Growth issues – present & future [contd] • What are the causes of environmental problems and poverty? Will slowing down pop growth rate solve such problems? • Demographic transition – 4 stages
5.Growth issues – present & future [contd] • Demographic transitions: • 1st stage - High DR, Short LE, High BR • 2nd - Lowered DR, Still high BR • 3rd - BR beginning to fall, close to DR, growth rate gradually falling • 4th- DR & BR close and low level; • Q: which actions or policies* will initiate declines in the BR
5.Growth issues – present & future [contd] • World growing at 1.2 % p.a.(977m) • 9.3 - 12b by 2050? India 21% • China 12% • Pakistan 5% • Nigeria 4% • Bangladesh 4% • Indonesia 3%
No rate of growth can be sustained indefinitely • Zero pop gwth must be achieved once again • To stop growing, global TFR has to drop fr present 2.8 to 2-child average per woman. • Will it happen? • No. WHY?