Download

1 / 10
100 likes | 210 Views
The C leverMag algorithm. Get the maximum from geophysical data using a user-constrained oriented interpolation algorithm. T he CleverMag interpolation: An example….

E N D
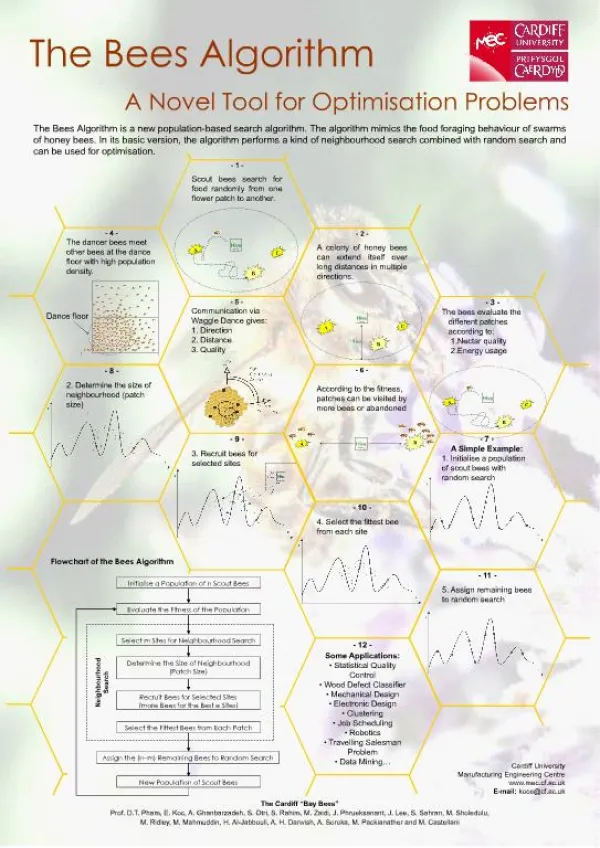
The CleverMag algorithm Get the maximum from geophysical data using a user-constrained oriented interpolation algorithm.
The CleverMag interpolation: An example… Figure 1 is a grid generated from an aeromagnetic survey flown along E-W flight lines with the widely recognised Spline interpolation*. “Spotty” magnetic anomaly Figure 1 “ Yellow spots “ are generated when the trend of the anomaly is almost parallel to the flight lines. This because nothing force the interpolation algorithm to “connect” these high magnetism zones together along this direction.
The CleverMag interpolation: An example… Figure 1 is a grid generated from an aeromagnetic survey flown along E-W flight lines with the widely recognised Spline interpolation*. Figure 1 “ Yellow spots “ are generated when the trend of the anomaly is almost parallel to the flight lines. This because nothing force the interpolation algorithm to “connect” these high magnetism zones together along this direction.
The CleverMag interpolation: An example… However, pre-existing Landsat satellite imagery (or even Google Earth) provides geological information (Figure 2). Figure 2 This information should be used to orientate the interpolation… Let’s use the CleverMag interpolation algorithm!
The CleverMag interpolation: An example… However, pre-existing Landsat satellite imagery (or even Google Earth) provides geological information (Figure 2). Figure 2 This information should be used to orientate the interpolation… Let’s use the CleverMag interpolation algorithm!
The CleverMag interpolation: An example… Figure 3 is the result of the CleverMag interpolation. The previous “yellow spot” are now connected together and would indicate a discrete continuous unit of high magnetic susceptibility. Figure 3 In addition, the apex of the fold appears more natural. Geologic interpretations become more precise! Easy to use. It only needs two sets of data: TMI along the flight lines (measurements) and orientation lines.
The CleverMag interpolation: An example… Before… Figure 1 After… Figure 3
The CleverMag interpolation: An example… Alternatively, the orientation of the magnetic interpolation can be defined directly from a DEM. Here is an example of utilisation of the CleverMag algorithm for Heavy Mineral sands exploration (Figures 4, 5, 6). Offshore potential? Discrete non-spotty response Figure 4: Aerial photo Figure 5: TMI interpolated with the Spline algorithm from a 200m line spacing airborne magnetic survey Figure 6: Oriented interpolation with CleverMag following the modern coastline
The CleverMag interpolation: An example… • By (1) calculating the TMI differences along the flight lines (Mudge, 1991) then (2) performing a CleverMag oriented interpolation, short wavelength anomalies (often related to geological bodies located closer to surface) are highlighted (Figure 7). HM prospective subsurface anomaly Figure 6: Oriented interpolation of the TMI. Figure 7: Oriented interpolation of the TMI differences calculated along the flight lines.
The CleverMag interpolation: An example… • Advantages of the method: • Finer interpolation if the orientation of the stratigraphy can be interpreted from pre-existing data or knowledge. • More “natural” non-spotty results (see the example of the fold, Figure 1 and 3). • Can be useful for the interpretation of old datasets with widely spaced flight lines. • Possible utilisation for offshore magnetic interpolation ? • The interpolation can be as fine as the distance between two measurement point (but would require a long computing time). • By calculating the TMI differences along the flight lines then performing an oriented interpolation, short wavelength anomalies (closer to surface) are highlighted. • Possible other utilisations of the oriented interpolation algorithm : EM, radiometrics... • ” Get the maximum from the data!” Reference in slide 10: Mudge, S.T., 1991. New Developments in Resolving Detail in Aeromagnetic Data. Exploration Geophysics 22, 277-284