Download
1 / 21
210 likes | 414 Views
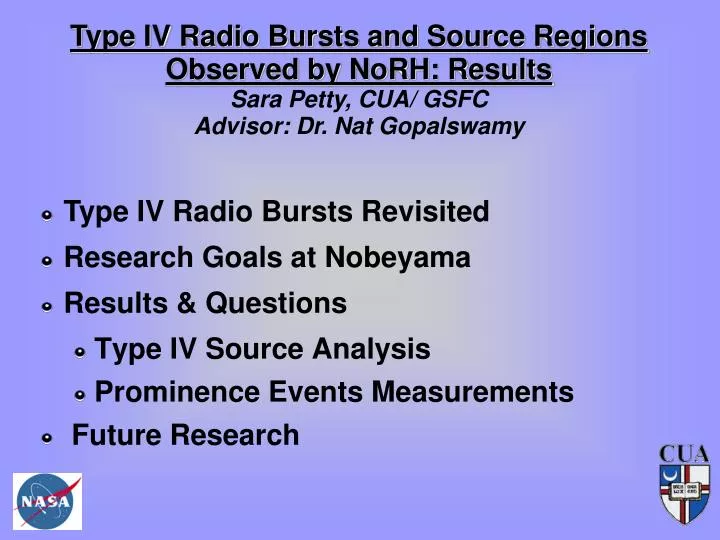
Type IV Radio Bursts and Source Regions Observed by NoRH: Results Sara Petty, CUA/ GSFC Advisor: Dr. Nat Gopalswamy. Type IV Radio Bursts Revisited Research Goals at Nobeyama Results & Questions Type IV Source Analysis Prominence Events Measurements Future Research. Type IV Radio Bursts.

E N D
Type IV Radio Bursts and Source RegionsObserved by NoRH: Results Sara Petty, CUA/ GSFCAdvisor: Dr. Nat Gopalswamy • Type IV Radio Bursts Revisited • Research Goals at Nobeyama • Results & Questions • Type IV Source Analysis • Prominence Events Measurements • Future Research
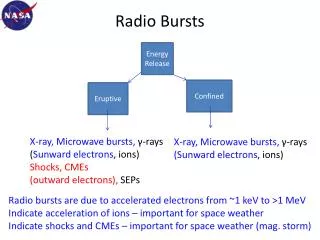
Type IV Radio Bursts • Type IV's occur less often than type II's • Have a broad spectral structure over many frequency ranges (MHz-GHz) and up to several hours in duration • Occur within 30 minutes of flare onset • Correlated CME's are faster and wider • Stationary IV's are caused by electrons trapped in the magnetic loop structure (What I observe) • Moving IV's are plasmoids containing their own magnetic fields moving 100-1000kms-1 and are very difficult to observe without spacial resolution(See Stewart 1985)
WIND/WAVES Observations of Type IV's • These are Type IV's that range from ~4MHz – 14MHz and have deca-hectometric (DH) wavelengths. • DH IV's are continuations of metric IV's. • Limb events appear very faint, if at all. • Position is discerned by correlating impulsive flare time with the type III event preceding the metric IV.
Metric and DH IV event –note the IV minimum begins at the flare peak time.
Goals and Expectations for Visit • Learn analysis tools for NoRH data • Look at DH IV source regions with radioheliograph data and compare dynamics with metric IV bursts • Make height-time and mass measurements of limb events (prominence eruptions) and compare with CME measurements (see Gopalswamy and Hanaoka 1998) • Obtain a relation between PE's and CME's masses
Results: Source Regions of 3 Type IV Events • 9 DH events fit within the NoRH observation window • Synthesized images for all 9 events with a 1 minute interval • I will discuss 3 events: • Events: 2001-04-10 (05:26), 2004-11-06 (00:34), & 2005-07-27 (05:02) • Stats table • Dynamic Spectra for Metric and DH IV's • TSX time-series data • NoRH polarization images • Height-time & mass measurements for 1 limb event: 2005-07-27 (05:02) Flare Peak
Type IV Stats • Height-time measurements could not be obtained for any of the events, except 2005-07-27, the only limb event from the list. • The CME data comes from the CDAW LASCO Catalog
Metric and DH dynamic spectra –note the ~15MHz gap between spectra Minimum occurs at 06:15 at 7.1MHz
Overlap in frequency is denoted by the dashed line. Minimum occurs at 02:00 at 7.1MHz The flare correlation may not be correct, NoRH data shows different –this is “confused” spectra Flare
The Type IV Dynamic Spectra for the Limb Event BIRS/GDRT 2005-07-27 overlap in frequency is denoted by the dashed line. Minimum occurs at 04:55 at 9.8MHz very faint and small compared with other events
Left: TSX Polarization time-series; dashed lines indicate type IV start and minimum times. Below: 17GHz polarization images
Left: TSX Polarization time-series; dashed lines indicate type IV start and minimum times. Below: 17GHz polarization images
Left: TSX Polarization time-series; dashed lines indicate type IV start and minimum times. Below: 17GHz polarization images
Maximum height before eruption (left) ~51,000km Maximum height before leaving field of view (right) ~200,600km Mass: ~4.7x1028cm3 Mean Speed: 422 kms-1 2005-07-27 Limb Event
Height-Time Plot for PE 2005-07-27 2.5x10⁵ 2.0x10⁵ 1.5x10⁵ 1.0x10⁵ 5.0x10⁴ Time (sec) starting from 27-Jul-05 04:37:30 The mean speed is ~ 422 km/s
Questions and Feedback • The DH IV events 2001-04-10, 2004-11-06, 20050727 have different structure and duration. • The time-series data shows mixed results • How does this fit with previous study finding flare peak time correlates with the Type IV minimum? • Modeling of type IV based on polarization plots
PE Mass Measurements & CME's • Checked measuring methods with Gopalswamy and Hanaoka (1998) • Used a simple box volume calculation, multiplied by density of 1010cm-3 (Tandberg-Hanssen 1995) and mass 2x10-24g • Gopalswamy and Hanaoka had a volume ~3x1030 cm3--> 6x10¹⁶g • My calculations • volume: ~7x1030cm3 mass: ~1.4x10¹⁷ • Fine structures were ignored (i.e., loop structure); the actual mass of the PE is smaller.
PE Measurement from Gopalswamy & Hanaoka (1998) The measurements were made during final height before eruption. PE 1994-04-04 ~23:00 UT
Future Plans • Analyze more synthesized NoRH images to compare the remaining type IV events. • Develop a working model for type IV's • Compare with MDI plots • Complete PE mass and height-time measurements for the NoRH prominence events from 2002-2005. • Compare mass and speed with LASCO CME data