Download
1 / 24
310 likes | 693 Views
3D GIS for E-Planning: Urban land use, density and sustainable development. CASE Award: ‘3D GIS for E-Planning and E-Democracy’ 1st Year Progress Presentation 14/02/07 Duncan Smith. Talk Summary. Introduction to Virtual London project London planning and policy context

E N D
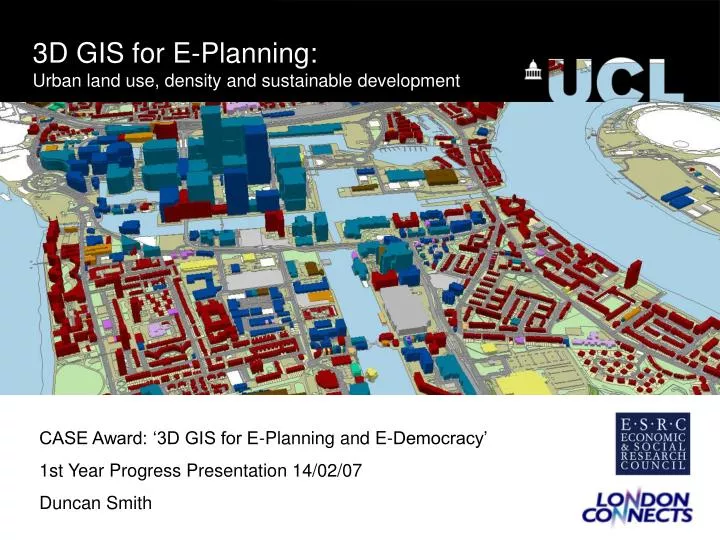
3D GIS for E-Planning: Urban land use, density and sustainable development CASE Award: ‘3D GIS for E-Planning and E-Democracy’ 1st Year Progress Presentation 14/02/07 Duncan Smith
Talk Summary • Introduction to Virtual London project • London planning and policy context • Land use mapping in 3D GIS, Isle of Dogs/Canary Wharf example • Housing density analysis • Office density and High Buildings Policy • Conclusion
Virtual London Ongoing project developing 3D model of London (Batty & Hudson-Smith, 2005) Base of the model uses building outlines from OS MM combined with LIDAR height data, heights aggregated for each polygon. Coverage across Greater London. Aim of the research to improve communication and public participation in planning. Licensed for all London Boroughs to use model through London Connects.
Virtual London Applications • Visualisation of planning data- • provides sense of place, engaging for public communication. • Example of pollution mapping, project with British Oxygen Foundation. • Online visualisation allows widespread access via digital globe/web interface, potential for interactivity. Licensing issues. • Base for detailed textured 3D models. Before and after visualisation of urban change using photo texturing and modelling techniques. • Visual Impact Assessment- widespread practice in development control, need automated techniques improving geometric and photo texture detail.
GIS Analysis and Virtual London • Potential to use the model for GIS planning analysis, currently lacking attribute data and spatial analysis functionality. • Attribute data- • Fundamentally need land use data for planning. New datasets becoming available. • Link to planning databases (London Development Database from GLA). • Further socio-economic data useful e.g. census (at coarser scale). • Physical urban form data e.g. energy efficiency of buildings (Steadman & Bruhns, 2000). • Spatial analysis- • Density of population (dwelling density indicator), office space (Valuation Office). • Accessibility- good pedestrian access to services and public transport necessary for achieving more sustainable travel. Calculate small scale accessibility measures, possibly link to existing larger scale transport model data. • Differences from typical GIS models: • Finer Scale: GIS generally use aggregated data, urban form and development analysis benefit from finer scale, data at individual building level, compliment larger scale analysis. • 3D: represent multiple land uses, explore major issue of high rise development. Challenges with data, standardised datamodels, analysis in true 3D.
London Planning Context • Period of sustained economic growth. Substantial employment growth, led by service industries, particularly business services, predicted to continue. • Offset partly by loss of 600,000 manufacturing jobs in last 30 years, sector still shedding jobs (GLA, 2004). • Population steadily rising- 7.5 million in 2006 (GLA, 2006), 8.2 m 2016. Still lower than historical peak of 8.6 million in 1939. • Planners face number of related challenges from this growth: • Housing shortages • Regeneration following industrial decline. • Accommodating growth (minimise ‘town cramming’ and congestion). Source: London Plan (GLA, 2004)
London Growth and Sustainable Development • Establishing Greater London Authority important change in providing unified development strategy and policies across Greater London. • Annually monitored targets for Borough Councils on new homes constructed, brownfield land development, density of development. • Planning policy all within framework of sustainable development. Aspects in current planning policy: • Efficient use of land, minimise development on greenbelt, encourage brownfield development. • Allow high density development in general and particularly at public transport nodes, more mixed use developments. Intended to encourage sustainable travel, more walking and cycling. • Also issues of emissions during construction, energy efficiency during use- not looked at in this research. • In general agreement with compact city ideas (Jenks et al, 1996), but contested concept in academia. London Plan Monitoring Report (GLA, 2006)
Urban Form and Sustainable Travel • “Although promotion of the compact city is now enshrined in land use policy in the UK, there is little evidence to support the many claims in its favour”(Burton, 2002). • Car ownership and fuel prices most important factors in determining travel behaviour (Breheny et al, 1998). Transport planning measures (parking provision, road capacity) also influential. Despite lack of strong relationship between urban form and travel, still important to measure urban form and accessibility. Provide opportunity for sustainable travel, necessary but not sufficient condition. Built form timescale long term (decades, centuries), private vehicle costs (fuel prices) likely to rise substantially in this period. Opportunity for finer scale measures to explore density and accessibility- “defining compact city using density figures without any consideration of built form, may lead to the failure of the concept” (Sherlock, 1996)
Employment Density • Trends in knowledge economy encourage clustering jobs in city centre, agglomeration of business services (Sassen, 2000). • London’s global financial centre expanding (Southwark, East End). • Subcentre structure weaker, major dense employment subcentres at Croydon and Canary Wharf. • Edge City effects at Heathrow and M4/M1 corridors. • Monocentric structure encourages public transport use but can also increase commuting times (Breheny et al, 1998) . Employment Density Map (GLA Economics, 2003)
Visualising Land Use • Recently released OS Address Layer 2 now includes • land use attributes. First fine scale comprehensive • land use data for UK. • Each Address Point linked to a building polygon. • 3 Classifications Included- • OS Base Function- very specific classification • (1000+ categories) • e.g. Travel Agency, Cathedral, Dwelling. • National Land Use Database- more manageable number of categories e.g. Retail, Residential. But incomplete. • Valuation Office- Similar to NLUD but only commercial properties. • Decided to use Base Function attribute, generalise into simpler classes. • Isle of Dogs- example to test concept and accuracy of data. Isle of Dogs area of massive redevelopment, great contrasts in land use and building scale, symbolic of structural economic change. • Also less mixed use buildings than central London, simplifies classification.
Isle of Dogs Background • West India Docks constructed in 1802, part of world’s largest port in 19th century. • Isle of Dogs urbanised to house dock workers (21,000 in 1901). • Growth continues into 20th century, then containerisation and structural economic change in the 1970s lead to massive decline.
Canary Wharf Background • West India Docks close 1980. Large areas of derelict and abandoned land. • Conservative government attempt to revive area- set up Enterprise Zone 1982 with tax allowances, planning restrictions lessened. • Plan for 12.2 million sq. ft. office development at Canary Wharf, infill part of West India Docks. Centrepiece UK’s tallest tower at 1 Canada Square, completed 1991. • 1992- recession sends developers into administration. Lack of transport infrastructure. • 1996- Canary Wharf bought by international • consortium. Jubillee Line station opens in 1999. • Period of rapid expansion. New towers for • Citybank, Credit Suisse, HSBC. • 13,400 employees in 1996 • 82,000 by 2006.
Residential Office Retail Residential Mixed Use Office Mixed Use Land Use Classes • Aiming for visualisation that is easily comprehended from map, maintains major land use categories for urban context. • Emphasis on home/work/retail division: Also interested in more specific land uses, categorising urban area, local services and facilities that encourage sustainable travel: Local Services-health centre, community centre, church, post office etc. Leisure-cinema, gallery, gym. Education-schools, further edu Industrial-warehouses, factory Pub/Restaurant-cafes, takeaway Emergency Services Hotel-guest houses, hostel Mixed Use Categories, dominant land use:
Housing Density • Land use data can also be used to calculate the number of dwellings per building, and then create a dwelling density surface. • Developers attracted to waterside. • ‘Canyonisation’ of the Thames? • (Karadimitriou, forthcoming), • social and physical division. • Marketed as sustainable development. • Interesting to combine with accessibility • data, parking data. • Temporal perspective lacking. • Also detailed housing data, planning class, • Affordable housing. Link to London • Development Database from • the Greater London Authority.
Accessibility Measures • Planning policy directs that new development should be accessible by public transport, and that higher density development should be focussed at public transport nodes. But not necessarily priority in private sector development. • Accessibility data could be combined with housing/office density data to measure success of policy. • Public Transport Accessibility Level (PTAL) common measure used in London. Tends to be contour measure, sharp cutoffs, and doesn’t model destinations beyond public transport nodes. • More sophisticated measures based around Hansen indices, weigh all available opportunities from an origin (e.g. population zones) to destinations (e.g. services) by the deterrent effect of travel to each (Hansen, 1959). • Virtual London model offers opportunity for finer scale accessibility measures. Not yet setup with network data. Greater London Public Transport Accessibility Map (TfL, 2004)
3D Land Use Visualisation • Metropolitan areas (Central London) dominated by mixed use buildings- single buildings categories less useful. • Possible to slice 3d building volumes into distinct land uses. • Lack of floor information means effectively guessing at vertical land use distribution. Assume retail/restaurant/leisure at ground level, residential typically highest level. • Another source of error is property divisions changing between floors. Ideally need volume or layer datamodel (Slingsby, 2006). • Need to assess accuracy. Floor information sources- Valuation Office?
Measuring Office Density • Potential to map density of office space by linking land use model to Valuation Office data. • City of London restricted heights to preserve views of St Paul’s since 1930 (City of London, 2002). • Possible to investigate how policy has influenced development over this period. • New cluster of towers given planning permission north west of Bank (Bishopsgate, Leadenhall Street). Current debate on strategic views policy.
Conclusion • Attributing the Virtual London model with socio-economic data provides base for spatial analysis of planning issues at fine scale. • Land use data visualisation potential to be highly useful to planners. Need to test accuracy, develop 3D visualisations, use standard classifications, feedback from planners. • Intend to use model to explore sustainable development issues: • accessibility and density of development, accessibility and land use, local services and sustainable travel. Which accessibility measures most useful? Scale of analysis. • Link planning policy to urban form: • High buildings policy, more detailed urban design measures possible?
Thank you for listening! • Welcome any comments and questions. • References • Batty, M. & Hudson-Smith, A. (2005), Urban Simulacra: London, Architectural Design, Vol 5, 6, pp 42 – 47. • Breheny,M.,Gordon,I.,Archer,S.(1998), ‘Building densities and sustainable cities’, Engineering and Physical Sciences Research Council (EPSRC), Sustainable Cities Programme, Project Outline No. 5, June 1998. • Burton, E. (2002), Measuring urban compactness in UK towns and cities, Environment and Planning B: Planning and Design 2002, 29, pp 219 – 250. • Greater London Authority (2004), The London Plan: Spatial Development Strategy for London, GLA. • Jenks, M, Burton, E., Williams, K. (2000) The Compact City: A Sustainable Urban Form?, (Spon. London). • Sassen, S (2000), The Global City: New York, London, Tokyo, Princeton University Press. • Sherlock, H. (1996), “Repairing our much abused cities: the way to sustainable living”, in The Compact City: A Sustainable Urban Form?, eds. Jenks, M, Burton, E., Williams, K. (Spon. London) pp 66 – 73.
Affordable Housing and Sustainability • Provision of affordable housing priority in London - public service workers, social polarisation. • Local authority negotiate proportion of affordable housing with developer during planning permission. • Arsenal example- new stadium development, 1200 homes. Islington council secure 40% affordable. • Affordable housing built at very high density next to tube station. Highly sustainable from accessibility view. • But amenity, public realm issues- next to railway and waste centre, no public space, dark street environment.
Mixed Uses and Subcentre Structure • London centre dominant, also hundreds of subcentres, local services. Can be measured spatially using employment diversity data. • (Thurstain-Goodwin & Batty, 2001) • ‘Urban village’ ideal of local services accessible on foot, strong communities, urban texture of London (Sherlock, 1996). • Encourage sustainable travel? Potential to- history in London of centres developing around rail and underground stations. • Nodes on road network also create subcentres, especially Greater London. Diversity Index Greater London (Batty et al, 2003)
References • Batty, M. & Hudson-Smith, A. (2005), Urban Simulacra: London, Architectural Design, Vol 5, 6, pp 42 – 47. • Breheny,M.,Gordon,I.,Archer,S.(1998), ‘Building densities and sustainable cities’, Engineering and Physical Sciences Research Council (EPSRC), Sustainable Cities Programme, Project Outline No. 5, June 1998. • Burton, E. (2002), Measuring urban compactness in UK towns and cities, Environment and Planning B: Planning and Design 2002, 29, pp 219 – 250. • Greater London Authority (2004), The London Plan: Spatial Development Strategy for London, GLA. • Jenks, M, Burton, E., Williams, K. (2000) The Compact City: A Sustainable Urban Form?, (Spon. London). • Sassen, S (2000), The Global City: New York, London, Tokyo, Princeton University Press. • Sherlock, H. (1996), “Repairing our much abused cities: the way to sustainable living”, in The Compact City: A Sustainable Urban Form?, eds. Jenks, M, Burton, E., Williams, K. (Spon. London) pp 66 – 73.