Download
1 / 44
440 likes | 556 Views
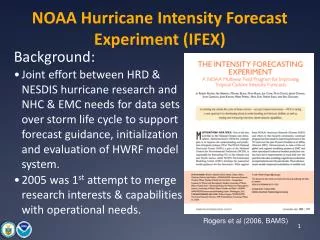
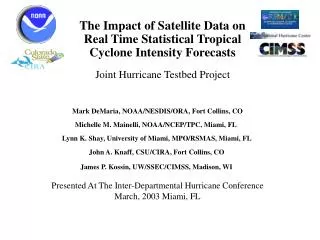
Applications of Satellite Data for Tropical Cyclone Intensity and Wind Structure Analysis and Forecasting. Mark DeMaria NOAA/NESDIS/ORA-STAR Presentation to The Hurricane Intensity Research Working Group NCAR, Boulder, Colorado March 1, 2006. Outline. Intensity Estimation Dvorak

E N D
Applications of Satellite Data for Tropical Cyclone Intensity and Wind Structure Analysis and Forecasting Mark DeMaria NOAA/NESDIS/ORA-STAR Presentation to The Hurricane Intensity Research Working Group NCAR, Boulder, Colorado March 1, 2006
Outline • Intensity Estimation • Dvorak • Impact on long term intensity trend detection • AMSU methods • Wind structure • Ocean surface winds • GOES and AMSU methods • Statistical intensity forecasting (SHIPS) • Satellite altimetry and GOES input • Current JHT projects for SHIPS improvements • Recon data input • Ocean cooling parameterization • New decay formulation • Revised shear calculation • Forecast Probability Model
Dvorak Methods • Visible (Dvorak 1972) • Pattern recognition • curved band, shear, CDO, eye • Assign T-number and time constraints • Convert to current intensity (CI) • IR (Dvorak 1984) • Convert cold ring and warm eye to intensity • AODT (Velden et al 1998) • Automated version of IR technique
Impact of P/W Relationship on Long Term Intensity Trends in the NW Pacific • Knaff P/W: • Corrects for • env. press. • storm motion • storm size • latitude
Advanced Microwave Sounder Unit (AMSU) Intensity Algorithms • AMSU on NOAA polar orbiting satellites • Provides temperature profiles ~3 km vertical, 50 to100 km horizontal resolution • CIRA and CIMSS algorithms relate upper warm core to intensity • CIRA algorithm operational at TPC • CIMSS run in real time at UW • Reasonable results TS to ~ Cat 2
Scatterometer (active) Radiometer (passive) Two Types of Ocean Surface Wind Instruments Windsat QuikSCAT • MW radiometer directly measure naturally originating thermal mw radiation from wind roughened ocean surface that is in general partially polarized • Multiple frequencies and polarizations allow for simultaneous retrievals of different surface and atmospheric parameters • Surface parameter retrievals more complicated in storms • A scatterometer is an active instrument that transmits a known microwave signal and measures the backscattered energy from the ocean surface. • Designed to retrieve the wind speed and direction in all weather conditions • Currently being used by the operational weather community • Retrievals impacted only in higher rain events Slide from Zorana Jelenak, NESDIS/ORA
Ocean Surface Winds • Measures surface wind (no reduction needed) • Limited to ~70 kt • Some directional ambiguity • Problems in heavy rain • Windsat still under evaluation Windsat Surface Winds from Katrina 28 Aug 05 Slide from Zorana Jelenak, NESDIS/ORA
Other Satellite Wind Measurements • Feature track winds from GOES • MODIS polar winds • Balance winds from AMSU and other satellite soundings • SSM/I wind speeds
New Capabilities with NPOESS and GOES-R • NPOESS • ATMS • Similar to AMSU with 30 km resolution • CrIS • Hyperspectral IR sounder • CMIS • Passive ocean surface winds, soundings • Ocean altimeter • VIIRS IR and visible imager • GOES-R • Advanced Baseline Imager • Hyperspectral Environmental Suite (sounder)
Satellite Data in the SHIPS Model • Statistical-dynamical intensity model (12-120 hr) • Climatology, persistence, SST and atmospheric (vertical shear, upper-level T, etc) predictors • Reynold’s SST, NCEP global forecasting system • Empirical decay for portion of track over land • Track from NHC forecast • Developed from 1982-2004 sample • 2006 version will include 2005 cases • Satellite altimetry and GOES data included
Atlantic Intensity Model Errors 2001-2005 All Cases Over Water Only N=1844, …, 695 N=1630, … , 481
SHIPS Limitations • Generally under-predicts rapid intensification • Tends to over-predict intensity for very weak storms • Difficulty with storms that move over land and back over water • Too much decay for storms moving over narrow landmasses
JHT Projects to Improve SHIPS • P1: 2002-03: Add ocean heat content and convective predictors from satellite altimetry and GOES data • Implemented operationally in 2004 • P2: 2004-05: Test predictors from aircraft reconnaissance data • P3: 2004-05: Add ocean cooling parameterization (w\ J. Cione) • P4: 2006-07: Develop new methods for calculating vertical shear and over-land decay
P1: GOES Predictors in SHIPS • Percent channel 4 IR (10.7m) pixels colder than 20oC r=0 to 200 km • Standard deviation of channel 4 brightness temperature r=100 to 300 km • Minor impact in Atlantic, but significant impact in the east Pacific
P1: Inclusion of Ocean Heat Content • OHC retrieved form satellite altimetry data • Integrated heat excess from depth of 26oC isotherm to the surface • Real time system set up at NHC by M. Mainelli and N. Shay in 2002 • Atlantic only • Made Operational in 2004 • Small positive impact for large sample • 1 to 2% reduction in average errors
Hurricane Katrina Intensity and SST and NHC Ocean Heat Content Analysis OHC SST
Hurricane Isabel Intensity and NHC Ocean Heat Content Analysis
Atmospheric Response to OHCHurricane Ivan (2004) Example • Rapid variations in OHC from • 13 Sept 18 UTC to 15 Sept 18 UTC • Response in IR imagery • Response in low level e near storm • center from aircraft recon data
Sample e Analysis for Ivan Analyzed e (oK-300) U.S. Air Force Reserve flight level (700 hPa) winds
Adjustment of SHIPS Intensity Forecast Due to OHC Predictor ___ - OHC + (------------ ------------)
Impact on SHIPS Forecasts for Category 5 Storms since OHC was Added • Isabel (03), Ivan (04), Katrina, Rita, Wilma (05) • Verify only over-water part of forecast
P2: SHIPS Predictors from Recon Data • Objectively analyze flight-level winds in storm relative coordinates • Variational fitting method with quality control • Cylindrical coordinate system, r=0 to 200 km • Azimuthal smoothing >> radial smoothing • Combine data over 9 hour periods, every 6 hours • ~1100 cases from 1995 to 2005
Sample Analysis for Hurricane Jeanne 2004 Input Data Wind Analysis Isotachs Is there predictive information in the wind analyses?
Intensity Change and Storm Structure • Compare inner core flight-level kinetic energy and maximum wind 2 200 km • KE = ½ (u2+v2)r dr d z 0 0 = 0.9 kg/m3 z = 1000 m
Divide KE into 5 “Categories” Max Wind (kt) KE (Jx1016) • Cat 0 0-60 (53%)* 0-2.8 • Cat 1 65-80 (24%) 2.8-5.3 • Cat 2 85-95 (11%) 5.3-7.1 • Cat 3 100-110 (7%) 7.1-8.6 • Cat 4 115-135 (4%) 8.6-10.0 • Cat 5 > 135 (~1%) >10.0 * Percentiles based on 1947-2004 Atlantic Best Track
Max Wind vs. KE categories of 1995-2005 U.S. Landfalling Hurricanes Katrina2 05 KE-5 Ivan 04 Rita 05 KE-4 Fran 96 Wilma 05 KE-3 Isabel 03 Frances 04 Jeanne 04 Floyd 99 KE-2 Georges2 98 Georges1 98 Bonnie 98 Lili 02 Opal 95 KE-1 Bertha 96 Dennis 05 Bret 99 Charley2 04 Erin1 95 Earl 98 Claudette 01 Charley1 04 Erin2 95 KE-0 Katrina1 05 Gaston 04 Danny2 Danny1 97 SS-0 SS-1 SS-2 SS-3 SS-4 SS-5
GOES and Recon Intensity Prediction (GRIP) Model • Start with 16 basic SHIPS variables • Add OHC • Add GOES profile variables, 2 of 12 selected • 1) Cold pixel count • 2)Tb standard deviation • Add recon variables, 2 of 16 selected r=rm+20 • 1) Vdr r=rm-20 2) KE Deviation
Error Reduction of SHIPS Model Fit From Inclusion of Recon and Satellite Data
GRIP Model Test on 2005 Cases(Operational Conditions) N= 6554 for SHIPS, N=808 for GRIP
Underlying SHIPS Prediction Equation V6 = V0 + V6 V12 = V0 + V12 V120 = V0 + V120 V6 , V12 , …, V120 estimated empirically from SST, shear, etc Rearrange to give: V j+1 = V j + j+1/2 twhere j+1/2 = (V j+1-Vj)/t dV/dt = (t) (Continuous form of SHIPS model) Can a more general model be fit to the SHIPS data?
Generalized Prediction Equation dV/dt = V - (V/Vmpi)nV (A) (B) Term A: Storm growth, related to storm structure, shear Term B: Upper limit on growth as storm approaches its maximum potential intensity (Vmpi) Assume: , n are constants for all storms Vmpi can be calculated given SST, Tupper, etc is storm, time dependent
Error of Model Fit with -1 =24 hr, n=2, Single Over 72 hr Intervals (82-04 Sample) SHIPS, GRIP input being used to estimate for real time applications
Example of Generalized Model Fit Mitch 1998 24 Oct 00 UTC Best Fit –1= 29 hr
P3 and P4: Additional SHIPS Improvements • SST cooling • Algorithm developed by J. Cione • Estimates actual SST in storm core • Depends on latitutde, storm speed • Implemented in 2005 • New decay model • Reduced decay over islands and narrow land masses • Implemented in 2005 • New shear calculation • Shear calculated over 200-800 km annulus • Vortex removal methods for GFS so smaller area can be tested • To be tested in 2006
2005 Forecast Improvements Due to SST Cooling and New Decay Model
Monte Carlo Wind Probability Model • Randomly sample from NHC track, intensity, radii errors to estimate probability of 34, 50 and 64 kt winds 5-day cumulative probability of hurricane winds for Katrina from 28 Aug 2005 at 00 UTC Probability of 64 kt winds at New Orleans for Hurricane Katrina as a function of the time before landfall. NHC Watch at t=44 h, Warning at t=31 h
Probability Model for NHC Hurricane Warnings NHC storm total hurricane warning lengths 1963-2005 NHC storm average hurricane warning lead times 1963-2005 2004-2005 Average MC Probability at Warned Points = 28%
Summary • Satellite observations provide valuable wind and thermodynamic information • Need to be included in TC model assimilation • Many new satellite data types on the horizon • Ocean feedback small effect most of the time, large effect sometimes • Couple ocean model with assimilation needed for consistently accurate intensity prediction • Recon data has intensity prediction signal • Relationship of structure and intensity • Recon data needs to be assimilated • Still room for improvement of statistical techniques • NHC warning lengths decreasing and lead time increasing since ~2000