Download
1 / 53
530 likes | 716 Views
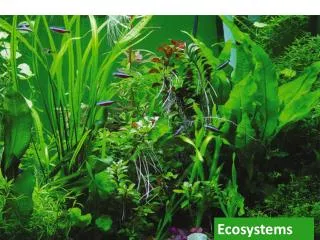
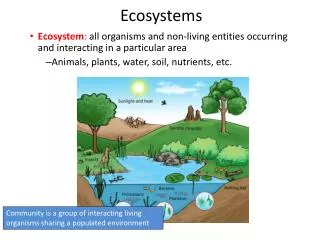
Ecosystems. Ecosystems. An ecosystem is all of the organisms in an area, along with their nonliving environment Example: aquarium Living + Non-living (Biotic + Abiotic). Trophic Levels. Organisms in a community are related to each other through feeding relationships

E N D
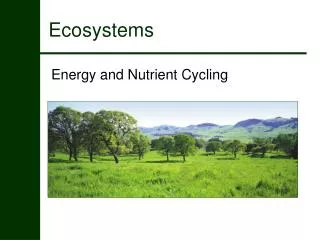
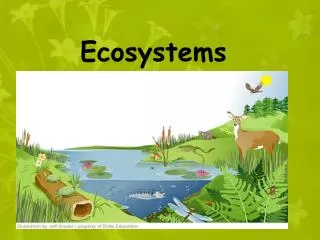
Ecosystems • An ecosystem is all of the organisms in an area, along with their nonliving environment • Example: aquarium • Living + Non-living • (Biotic + Abiotic)
Trophic Levels • Organisms in a community are related to each other through feeding relationships • Each step up in the transfer of energy is known as a trophic level • All energy ultimately comes from the SUN
Trophic Levels • Decomposers/ Detritivores • Eat detritus (organic waste/remains of dead organisms) • Can fit in to a food chain or web at any location
Trophic Levels • Producers • Convert solar (or chemical) energy into organic compounds • Primary consumers • Eat producers • Secondary consumers • Eat primary consumers • Tertiary consumers • Eat secondary consumers
Pyramid of Numbers/Biomass/Energy • Numbers, energy, & biomass decreases as one moves up the food chain. • Biomass- dry mass of organic matter
Trophic Levels • Ten-Percent Law • Usable energy is lost through each transfer of energy • Why? (Remember the law of conservation of energy says energy cannot be created or destroyed; it only changes form.) • Only about 10% of the energy at one trophic level is transferred to the next trophic level. 90% is lost as heat with each transfer.
marsh hawk Food Chain upland sandpiper • A straight-line sequence of who eats whom • Simple food chains are rare in nature garter snake cutworm plants
marsh hawk Tall-Grass Prairie Food Web sandpiper crow snake frog coyote weasel badger spider sparrow pocket gopher ground squirrel vole earthworms, insects grasses, composites
Primary Productivity • Primary Productivity: • The amount of light energy converted to sugars by autotrophs in an ecosystem • Gross vs. Net Primary Productivity • GPP: the amount of light energy that is converted to chemical energy by photosynthesis per unit time • NPP: GPP minus the energy used by the primary producers for cellular respiration GPP-R=NPP
Limiting Nutrients • What limits primary production? • Aquatic Ecosystems • Light (depth penetration) • Nitrogen • Phosphorus • Terrestrial Ecosystems • Temperature • Moisture • Minerals (N & P are the main limiting factors for plants.)
Biogeochemical Cycle • The flow of a nutrient from the environment to living organisms and back to the environment • Main reservoir for the nutrient is in the environment
Hydrologic Cycle Atmosphere precipitation onto land 111,000 wind-driven water vapor 40,000 evaporation from land plants (evapotranspiration) 71,000 evaporation from ocean 425,000 precipitation into ocean 385,000 surface and groundwater flow 40,000 Land Ocean Figure 48.14 Page 876
diffusion between atmosphere and ocean Carbon Cycle - Marine combustion of fossil fuels bicarbonate and carbonate in ocean water aerobic respiration photosynthesis marine food webs death, sedimentation incorporation into sediments uplifting sedimentation marine sediments Figure 48.16 Page 878
atmosphere combustion of fossil fuels volcanic action Carbon Cycle - Land aerobic respiration combustion of wood photosynthesis terrestrial rocks sedimentation weathering land food webs soil water peat, fossil fuels death, burial, compaction over geologic time leaching, runoff Figure 48.16 Page 878
Carbon in Atmosphere • Atmospheric carbon is mainly carbon dioxide • Carbon dioxide is added to atmosphere • Aerobic respiration, volcanic action, burning fossil fuels • Removed by photosynthesis
Greenhouse Effect • Greenhouse gases impede the escape of heat from Earth’s surface Figure 48.18, Page 880
Global Warming Long-term increase in the temperature of Earth’s lower atmosphere Figure 48.19, Page 881
Nitrogen Cycle • Nitrogen is used in amino acids and nucleic acids • Main reservoir is nitrogen gas in the atmosphere
Nitrogen Cycle gaseous nitrogen (N2) in atmosphere nitrogen fixation by industry food webs on land uptake by autotrophs excretion, death, decomposition uptake by autotrophs fertilizers nitrogenous wastes, remains NO3- in soil nitrogen fixation dentrification ammonification 2. Nitrification NH3-,NH4+ in soil NO2- in soil 1. Nitrification leaching leaching Figure 48.21 Page 882
Nitrogen Fixation • Plants cannot use nitrogen gas • Nitrogen-fixing bacteria convert nitrogen gas into ammonia (NH3) • Ammonia and ammonium can be taken up by plants
Ammonification & Nitrification • Bacteria and fungi carry out ammonification • conversion of nitrogenous wastes to ammonia • Nitrifying bacteria convert ammonium to nitrites and nitrates
Nitrogen Loss • Nitrogen is often a limiting factor in ecosystems • Nitrogen is lost from soils via leaching and runoff • Denitrifying bacteria convert nitrates and nitrites to nitrogen gas
Phosphorus Cycle • Phosphorus is part of phospholipids and all nucleotides • It is the most prevalent limiting factor in ecosystems • Main reservoir is Earth’s crust; no gaseous phase
mining FERTILIZER GUANO excretion agriculture uptake by autotrophs weathering uptake by autotrophs weathering MARINE FOOD WEBS DISSOLVED IN OCEAN WATER DISSOLVED IN SOILWATER, LAKES, RIVERS LAND FOOD WEBS death, decomposition death, decomposition settling out leaching, runoff sedimentation uplifting over geologic time TERRESTRIAL ROCKS MARINE SEDIMENTS Phosphorus Cycle Figure 48.23, Page 884
Human Impact on Ecosystems • Increased Eutrophication of Lakes • Increase in nutrient levels (phosphates, nitrates, etc.) • Can lead to algal blooms • Hypoxia • What is it? • Why? • Can lead to the eventual loss of fish and other aquatic organisms • Accelerated by sewage/factory wastes, leaching of fertilizers into freshwater
Human Impact on Ecosystems • Combustion of Fossil Fuels • Leads to acid precipitation • Changes the pH of aquatic ecosystems and affects the soil chemistry of terrestrial ecosystems
Human Impact on Ecosystems • Biological Magnification • Toxins become more concentrated as they move up the food chain • Toxins that are lipophilic cannot be excreted in urine (water!), so they are stored in fatty tissue (adipose tissue) unless the organism has enzymes to break it down • Important examples? • The biomass at any given trophic level is produced from a much larger biomass ingested from the level below
Human Impact on Ecosystems • Increasing Carbon Dioxide Concentration in the Atmosphere • Burning fossil fuels (wood, coal, oil) releases CO2 • Carbon dioxide and water in the atmosphere retain solar heat, causing the greenhouse effect
Human Impact on Ecosystems • Use of chlorofluorocarbons has destroyed ozone (O3) by converting it to oxygen gas. • Ozone protects against UV radiation • Increasing skin cancers, cataracts • What are your odds of getting skin cancer in your lifetime?
Rain Shadow Air rises on the windward side, loses moisture before passing over the mountain Leeward side is in the rainshadow; deserts Figure 49.7 Page 893
Biomes • Regions of land characterized by habitat conditions and community structure • Distinctive biomes prevail at certain latitudes and elevations
Tropical Forests • May be dry, deciduous, or rainforests • T. Rainforest • Abundant rainfall • 4 layers to forest (upper & lower canopy, shrub understory, & herbaceous layer) • Poor soil due to leaching • Highest species diversity
Grasslands • Savannas • Tropical & subtropical with scattered trees • 3 seasons: cool & dry; hot & dry; warm wet. • Frequent fires • Grazing mammals • (African grasslands)
Chaparral • Along coastlines in mid latitudes • Mild, rainy winters & hot, dry summers • Evergreen shrubs • Periodic fires • Browsers, rodents reptiles
Temperate Grassland (Prairie) • Similar to savannah without trees • Cold winters • Maintained by fire • Seasonal drought • Rich soils • Grazing animals; herbivores
Temperate Deciduous Forest • Our biome • 3 layered forest • Dominant species are deciduous trees • Midlatitudes
Deserts • Less than 10 centimeters annual rainfall, high level of evaporation • Tend to occur at 30 degrees north and south and in rain shadows • One-third of land surface is arid or semiarid
Arctic Tundra • Occurs at high latitudes • Permafrost lies beneath surface • Nutrient cycling is very slow • Coldest biome • Low species diversity Do not post on Internet Arctic tundra in Russia in summer Figure 49.19 Page 903
Taiga (coniferous forest) • Found in northern latitudes • Harsh winters; short summers • Thin, acidic soil • Coniferous trees • No permafrost
Alpine Tundra • Occurs at high elevations • No underlying permafrost • Plants are low cushions or mats as in Arctic tundra Do not post on Internet Figure 49.19 Page 903
Lakes • Bodies of standing freshwater Eutrophic: shallow, nutrient-rich, has high primary productivity, Oligotrophic: deep, nutrient-poor, has low primary productivity Lake Zonation LITTORAL LITTORAL LIMNETIC PROFUNDAL Figure 49.21 Page 904
Thermal Layering • In temperate-zone lakes, water can form distinct layers during summer THERMOCLINE Figure 49.22 Page 904
Seasonal Overturn • In spring and fall, temperatures in the lake become more uniform • Oxygen-rich surface waters mix with deeper oxygen-poor layers • Nutrients that accumulated at bottom are brought to the surface
neritic zone oceanic zone Ocean Provinces intertidal zone continental shelf sunlit water "twilight" water 0 200 PELAGIC PROVINCE bathyal shelf BENTHIC PROVINCE sunless water 1,000 2,000 abyssal zone 4,000 hadal zone deep-sea trenches 11,0000 depth (meters) Figure 49.24 Page 906
Phytoplankton • Floating or weakly swimming photoautotrophs; form the base for most oceanic food webs • Ultraplankton are photosynthetic bacteria
Hydrothermal Vents Do not post on Internet • Openings in ocean floor that spew mineral-rich, superheated water • Primary producers are chemoautotrophic bacteria; use sulfides as energy source Tube worms at hydrothermal vent Figure 49.26 Page 907
Estuary • Partially enclosed area where saltwater and freshwater mix • Dominated by salt-tolerant plants • Examples are Chesapeake Bay, San Francisco Bay, salt marshes of New England
Estuarine Food Webs • Primary producers are phytoplankton and salt-tolerant plants • Much primary production enters detrital food webs • Detritus feeds bacteria, nematodes, snails, crabs, fish