Download
1 / 4
40 likes | 116 Views
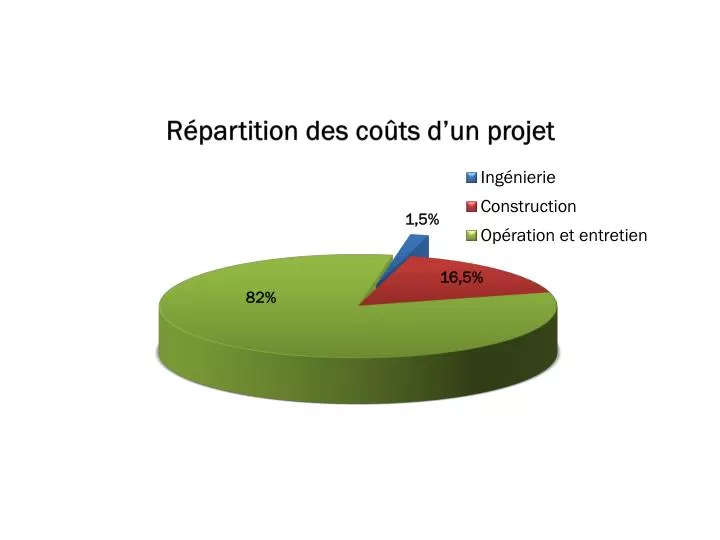
Répartition des coûts d’un projet. Les relations professionnelles entre l’ingénieur-conseil et les municipalités. Évolution du génie-conseil au Québec. 107. 21 480. Nombre de firmes. 22 000. 110. Nombre d’employés. 20 000. 100. 18 000. 90. 16 000. 80. 14 000. 70. 12 000. 52.

E N D
Les relations professionnelles entre l’ingénieur-conseil et les municipalités
Évolution du génie-conseil au Québec 107 21 480 Nombre de firmes 22 000 110 Nombre d’employés 20 000 100 18 000 90 16 000 80 14 000 70 12 000 52 8 772 60 10 000 0 0 2000 2001 2002 2003 2004 2005 2006 2007 2008 2009 2010
Répartition des coûts sur le cycle de vie du projet Source : Guide national pour des infrastructures municipales durables, Sélection d’une société d’experts-conseils, CNRC et FCM, juin 2006