Download
1 / 20
200 likes | 204 Views
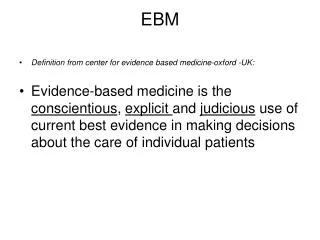
The true mission of information mastery is using medical u2018POEMu2019 to reform healthcare!<br><br>POEM = Patient-Oriented Evidence that Matters<br><br>Information mastery is built upon the principles of evidence-based medicine should not be just an academic exercise, but should play a role in day-to-day clinical practice.<br>

E N D
Information Mastery Skills Calculating RR, RRR, ARR and NNTs
Consider a clinical trial… • 200 subjects aged 59 years or older, with previous heart disease and type 2 diabetes randomised to 2 groups: • 100 receive experimental treatment (treatment group) • 100 receive control treatment (standard of care) • Follow-up is a mean of 5 years • Endpoint is a composite of all CHD deaths & non-fatal MIs
Results • The treatment is clearly more effective than the control: fewer people suffered CHD-death or non-fatal MI • How can we express how much more effective it is?
Relative Risk (RR) or Risk Ratio • What is the ratio of the rates of CHD-death or non-fatal MI in the 2 study groups? • RR = 20%/30% = 0.67 (or 0.2/0.3 = 0.67) • Subjects who took the experimental treatment for a mean of 5 years were 0.67 times as likely to die from CHD-related causes or suffer a non-fatal MI as those who took the control.
Relative Risk Reduction (RRR) • By how much has the experimental treatment reduced the risk of CHD-death or non-fatal MI? • RRR = 1-RR = 1-0.66 = 0.33 (or 33%) or • RRR = (difference in event rates)/control event rate • = (0.3-0.2)/ 0.3 = 0.1/0.3 = 0.33 (or 33%) • Subjects who took the experimental treatment for a mean of 5 years were 33% less likely to die from CHD-related causes or suffer a non-fatal MI than those who took the control: treatment has reduced the risk by 1/3
Absolute Risk Reduction (ARR) or Risk Difference • How many fewer subjects in the experimental treatment group suffered CHD-death or non-fatal MI? • ARR = 30% - 20% = 10% (or 0.3 - 0.2 = 0.1) • 10% fewer subjects (10 in every 100) who took the experimental treatment for a mean of 5 years did not die from CHD-related causes or suffer a non-fatal MI than those who took the control.
Number Needed to Treat for Benefit (NNT) • On average, how many people needed to take the experimental treatment for one to benefit? • ARR = 30% - 20% = 10% = 10 in every 100 • NNT = 1 in every 100/10 = 10 • On average, 1 in every 10 subjects who took the experimental treatment for a mean of 5 years did not die from CHD-related causes or suffer a non-fatal MI, who would have done had they all taken the control.
What if the Baseline Risk is lower? • RR = 2%/3% = 0.67 • RRR = 1 - 0.67 = 0.33 or 33% • ARR = 3%-2% = 1% • NNT = 100/1% = 100 • On average, 1 in every 100 subjects who took the experimental treatment for a mean of 5 years did not die from CHD-related causes or suffer a non-fatal MI, who would have done so had they all taken the control.
Let’s try to show this with a shopping analogy Apples were $3.00 a bag; now only $2.00 a bag Amount saved is $1.00 per bag (Original rate – new rate) Saving is 1/3 or 33%; (original rate – new rate)/original rate; i.e., 3-2 = 1; 1/3 = one third; 1/3 x 100 = 33%
Lets try to show this with a shopping analogy Apples were $30.00 a bag; now only $20.00 a bag Amount saved is $10.00 per bag (Original rate – new rate) Saving is 1/3 or 33%; (original rate – new rate/original rate; i.e., 3-2 = 1; 1/3 = one third; 1/3 x 100 = 33% Apples were $30.00 a bag; now $20.00 a bag Saving is $10.00 a bag Saving is STILL one third Would you go out and buy apples if the saving was ONLY described as “ONE THIRD OFF”?
Harms can be expressed in the same way • Relative risk RR = 3%/2% = 1.5 • Relative risk increase (RRI) = 1.5-1 = 0.5 or 50% or • RRI = (difference in event rates)/control event rate • = (0.03-0.02)/0.02 = 0.01/0.02 = 0.5 (or 50%) • Absolute risk increase or risk difference (RD) = 3%-2% = 1% • Number needed to harm (NNH) = 100/1% = 100 • The experimental treatment increased risk of major bleeds by 50%. On average, 1 in every 100 subjects who took it for a mean of 5 years suffered a major bleed which they would not have done had they all taken the control.
Weighing Risks and Benefits • In both groups, the experimental treatment reduced the risk of CHD death or non-fatal MI by 33% but increased the risk of major bleeds by 50% • On average, 1 in 10 of the higher-risk subjects benefited but 1 in 100 were harmed • For every 100 treated, 10 benefited and 1 was harmed • On average, 1 in 100 of the lower-risk subjects benefited but 1 in 100 were harmed • For every 100 treated, 1 benefited and 1 was harmed
In pictures www.nntonline.net
In pictures www.nntonline.net
In pictures www.nntonline.net
In pictures www.nntonline.net
In pictures www.nntonline.net
In pictures www.nntonline.net
Examples! • COPD exacerbation rates: 5% (treatment) vs. 6% (control) • Rate of upper GI perforations, obstructions or bleeds: 3% (treatment) vs. 5% (control) • Stroke or TIA: 21% (treatment) vs. 35% (control) • Proportion of patients reporting “good” or “excellent” improvement in osteoarthritis symptoms: 40% (treatment) vs. 30% (control)
Summary • RR, RRR, ARR andNNTare easy to calculate • RR and RRR or relative risk and relative risk reduction are constant • They tend to look impressive, but on their own they can be misleading • Absolute risk reduction and NNTs give the benefit in the population • The lower the baseline risk, the lower the absolute benefits (and the greater the NNT) for any given relative risk reduction • All the above applies to harms as well as benefits • We need to use absolute and relative terms consistently