Download
1 / 10
100 likes | 188 Views
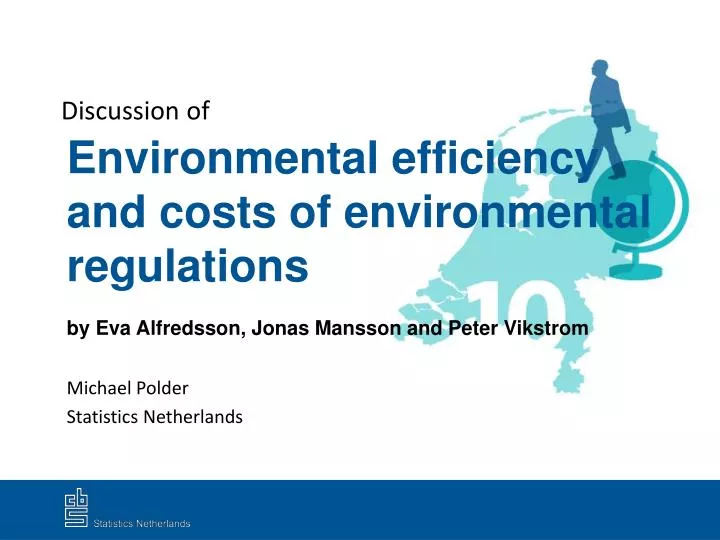
Discussion of. Environmental efficiency and costs of environmental regulations by Eva Alfredsson, Jonas Mansson and Peter Vikstrom. Michael Polder Statistics Netherlands. Comments. I am on thin ice…. Comments. I am on thin ice… and I’m not an ice skater. Summary of paper.

E N D
Discussion of Environmental efficiency and costs of environmental regulationsby Eva Alfredsson, Jonas Mansson and Peter Vikstrom Michael Polder Statistics Netherlands
Comments I am on thin ice… Presentation title
Comments I am on thin ice… and I’m not an ice skater Presentation title
Summary of paper • Looks at efficiency taking account of desired and undesired output: production and pollution • “Directional distance function” (DDF) • Allows to study efficiency along different directions, including multiple directions • Quantifies potential for improvement for Swedish pulp and paper industry • Quantifies cost of environmental regulation Presentation title
Good stuff • Topic breaks with traditional analysis looking at efficiency/productivity by comparing inputs with production • Important in the light of increasing pressure on environment and depletion of natural resources • Shift to new statistics: Stiglitz report… • Good graphical presentation • Policy relevance of quantifying cost of regulation Presentation title
Some thoughts Currently three directions: • desired output (1,0) • undesired output (0,1) • and both equally important (0.5,0.5) • Would it be possible to evaluate potential for efficiency improvement for different weights? • It would be interesting to see a graph of potential efficiency improvement for both directions as a function of its “importance weight” in the trade-off Presentation title
Some thoughts • The theoretical framework is unclear to me • Fare (1989) is referred to but section should be more self-contained • How are TE and DDF calculated from the data? Presentation title
Some thoughts • Analysis on 31 firms • Need more details on sample selection • How many firms are deleted? • What is the effect of using balanced sample? (Industrial dynamics is rather interesting in this context!) • Is the technology homogenous? Presentation title
Some thoughts • Benchmarking: are the figures good or bad? • What is good or bad in this case? • Highly competitive industry: firms try to improve efficiency (escape competition) • Relative efficiency for other firms declines, but their efficiency did not actually go down • … overall: the situation has improved..? Presentation title
Some thoughts • Cost of environmental regulation is calculated; but what is the benefit? • Policy implications? Presentation title