Download
1 / 18
200 likes | 331 Views
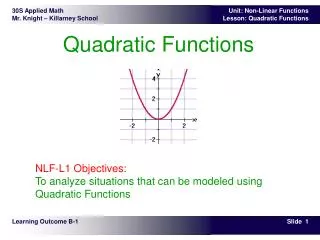
Transforming Quadratic Functions. The axis of symmetry is x = 0, or the y- axis. The vertex is (0, 0). The function has only one zero, (0,0).

E N D
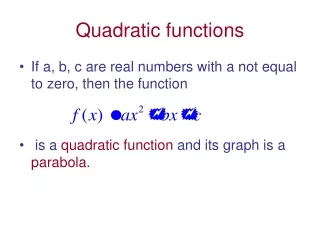
The axis of symmetry is x = 0, or the y-axis. • The vertex is (0, 0) • The function has only one zero, (0,0). The quadratic parent function is f(x) = x2. The graph of all other quadratic functions are transformations of the graph of f(x) = x2. For the parent function f(x) = x2:
The value of a in a quadratic function determines not only the direction a parabola opens, but also the width of the parabola.
f(x) = 3x2 g(x) = 0.5x2 Example 1: Comparing Widths of Parabolas Order the functions from narrowest graph to widest. f(x) = 3x2, g(x) = 0.5x2 The function with the narrowest graph has the greatest |a|.
g(x) = x2 Example 2 Order the functions from narrowest graph to widest. f(x) = x2, g(x) = x2,h(x) = –2x2 h(x) = –2x2 f(x) = x2
The value of c makes these graphs look different. The value of c in a quadratic function determines not only the value of the y-intercept but also a vertical translation of the graph of f(x) = ax2 up or down the y-axis.
g(x) = x2 + 3 • The graph of g(x) = x2 + 3 is wider than the graph of f(x) = x2. • The graph of g(x) = x2 + 3 opens downward and the graph of f(x) = x2 opens upward. Example 3 Compare the graph of the function with the graph of f(x) = x2. Method 1 Compare the graphs.
The axis of symmetry is the same. • The vertex of f(x) = x2 is (0, 0). The vertex of g(x) = x2 + 3 is translated 3 units up to (0, 3). g(x) = x2 + 3 Example 3 Continued Compare the graph of the function with the graph of f(x) = x2
Example 4 Compare the graph of the function with the graph of f(x) = x2 g(x) = 3x2 Both graphs open upward. G(x) is narrower than f(x).
Example 5 Compare the graph of each the graph of f(x) = x2. g(x) = –x2 – 4 The graph of g(x) opens downward, while the graph of f(x) opens upward. The graph of g(x) is translated down four units. both graphs have the same width.
The quadratic function h(t) = –16t2 + c can be used to approximate the height h in feet above the ground of a falling object t seconds after it is dropped from a height of c feet. This model is used only to approximate the height of falling objects because it does not account for air resistance, wind, and other real-world factors.
Example 6 Two identical softballs are dropped. The first is dropped from a height of 400 feet and the second is dropped from a height of 324 feet. a. Write the two height functions and compare their graphs. Step 1 Write the height functions. The y-intercept crepresents the original height. h1(t) = –16t2 + 400 Dropped from 400 feet. h2(t) = –16t2 + 324 Dropped from 324 feet.
Example 6 Continued Step 2 Use a graphing calculator. Since time and height cannot be negative, set the window for nonnegative values. The graph of h2 is a vertical translation of the graph of h1. Since the softball in h1 is dropped from 76 feet higher than the one in h2, the y-intercept of h1 is 76 units higher.
Example 6 Continued b. Use the graphs to tell when each softball reaches the ground. The zeros of each function are when the softballs reach the ground. The softball dropped from 400 feet reaches the ground in 5 seconds. The ball dropped from 324 feet reaches the ground in 4.5 seconds Check These answers seem reasonable because the softball dropped from a greater height should take longer to reach the ground.
Try these… • 1. Order the function f(x) = 4x2, g(x) = –5x2, and h(x) = 0.8x2 from narrowest graph to widest. • 2. Compare the graph of g(x) =0.5x2 –2 with the graph of f(x) = x2. g(x) = –5x2, f(x) = 4x2, h(x) = 0.8x2 • The graph of g(x) is wider. • Both graphs open upward. • It is translated down two units.
Try these… Two identical soccer balls are dropped. The first is dropped from a height of 100 feet and the second is dropped from a height of 196 feet. 3. Write the two height functions and compare their graphs. The graph of h1(t) = –16t2 + 100 is a vertical translation of the graph of h2(t) = –16t2 + 196 the y-intercept of h1 is 96 units lower than that of h2. 4. Use the graphs to tell when each soccer ball reaches the ground. 2.5 s from 100 ft; 3.5 from 196 ft