Download
1 / 96
970 likes | 1.18k Views
Colorimetry of Solid State Light Sources. J Schanda University of Pannonia, Hungary. OVERVIEW. Colorimetric descriptors CIE colorimetry Advanced colorimetry Luminance specification Brightness of coloured objects Brightness/luminance discrepancy Updating colorimetric calculations

E N D
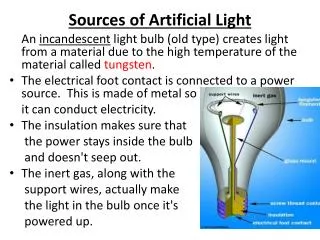
Colorimetry of Solid State Light Sources J Schanda University of Pannonia, Hungary
OVERVIEW • Colorimetric descriptors • CIE colorimetry • Advanced colorimetry • Luminance specification • Brightness of coloured objects • Brightness/luminance discrepancy • Updating colorimetric calculations • Application in lighting applications • Colour rendering • Colour gamut of displays
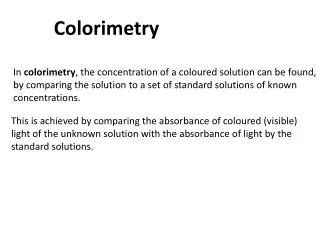
Colorimetry • Colour is a perception • Colorimetry can describe the colour stimulus in a form correlating to the perception • Basic colorimetry dewcribes colour matching under specified conditiions • Advanced colorimetry seeks correlates to characterise stimuli in dissimilar situations according to their perceptions
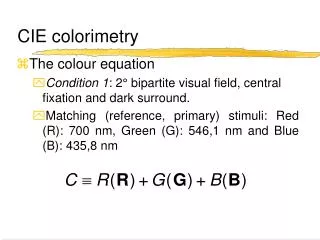
CIE colorimetry • Fundamental experiment of colour matching • Matching the test stimulus with the additive mixture of three matching stimuli • Matching stimuli:R: 700 nm redG: 564 nm greenB. 435 nm blue
Matching stimuli • 1 lm Red + 4,5907 lm Green + 0,0601 lm Blue = equienergetic white • Colorimetry coupled to photometry: L = 1.0000R + 4.5907G + 0.0601B
Matching stimuli • To match some monochromatic stimuli one of the test stimuli had to be added to the test stimulus to achieve colour match. • Linear transformation to a new set of non-real matching stimuli, called primaries.
Two sets of colour matching functions (CMF) • Most sensitive part of the retina, the fovea covered by a yellow pigmentation, thus central <4°part of fovea has different spectral responsivity: • CIE 1931 CMF = 2° Observer • CIE 1964 CMF = 10° Observer • 10° Observer not coupled to photometric observer
The tristimulus values The X, Y, Z tristimulus values of a colour stimulus
Chromaticity co-ordinates and diagram, dominant wavelength Dominant wavelength: D Excit. purity:
Descriptors • Coloured lights: Dominant wavelength • Near white lights: Correlated colour temperature (CCT)
Problems related to the colour matching functions-1 • CIE 2° system based on luminance, i.e. related to the V(l) function • V(l) function in error in the blue part of the spectrum
Problems related to the colour matching functions-2 • Enlarged view of the 2° photometric and colorimetric observers, and a proposal for a newCMF • Differences for blue LEDs can be considerable
Problems related to the colour matching functions-3 • Three sets of CMFs • CIE 2°Observer • CIE TC 1-36 recommen-ded functions • Vos primaries
Problems related to the colour matching functions-4 • CIE colorimetric match breaks down with LEDs: • Better description possible using LMS cone fundamentals derived colour matching functions
Cone fundamental based colour matching functions • CIE TC 1-36 developed CMF-s and recommendsa transformation to aCIE 2° similar system
LED chromaticity • Chromaticity co-ordinates of LEDs calculated in the standard 2° colorimetric system (x,y) and the cone fundamental based system xF,yF • Differences in second decimal figure
Visual and instrumental colour match • Visual and instrumental colour matches using standard and cone fundamental CMFs
Advanced colorimetry • Advanced colorimetry is needed: • Non-equidistantness of x,y diagram • Need to describe chromatic adaptation • Adaptation to different luminance levels • Chromatic adaptation • CIELAB system • CIECAM02 colour appearance model • Colour rendering, colour preference
Non-equidistanctness • Mac Adam ellipses
CIELAB system • L* 116(Y/Yn)1/3 - 16 • a* 500 ( X/Xn)1/3 - (Y/Yn)1/3 • b* 200 (Y/Yn)1/3 - (Z/Zn)1/3 • If X/Xn > 0,008856 • Y/Yn > 0,008856 • Z/Zn > 0,008856
Brightness/luminance Colours of equal luminance might have different brightness Covan-Warren experiment
Incandescent lamp, and lamp with a neodymium containing bulb. Colour rendering of two metal-halid lamps of different spectral distribution Colour rendering under different light sources
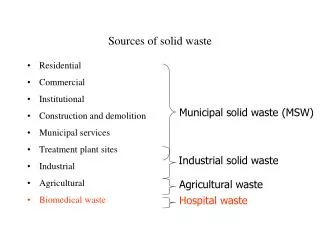
Spectral Band Methods (SBM) • Need to describe light source colour quality: Development of gas-discharge sources of different SPD but similar CCT • First CIE recommendation: 1948 for an 8 band SBM, deviation from full radiator. • Crawford: 6 bands of comaprable weight in colour rendering, tolerances from ideal spectrum in the single bands. • Comparing calculated values with visual obesrvations on picutres • Museum lighting • Bands: 400-455, 455-510, 510-540, 540-590, 590-620, 620-760.
New Working Committee • 1955: CIE established WC 1.3.2 with the following tasks • Terminology • Measuring method, compare: • and simplify the 1948 8 band method • test the test sample method • 1961: test colour method decided • Agreement: 8 test samples • 1964: test sample method agreed, without chrom. Adaptation: Publ. 13, 1st edition
Present test sample method • 1974: Publ. 13 2nd edition • Definition on reference illuminant, tolerances • Test samples: 8 + 6 • Von Kries chromatic adaptation transform • Use the CIE 1964 UCS • Scaling: WW halophosphate lamp should have an Ra of 50.
Post 1974 progress • Trials to define a flatery/preference index • Problem: • The use of Ra to optimize the SPD of tri-band fluorescent lamps • The new SPDs produced large negative indices • Solutions • Non-liner scaling from 0 to 100 • Other methods (e.g. rout mean square) for averaging Ri-s
Problems of the CIE Test Method • Samples look different under low and high CCT sources of equal Ra, break at 5000 K: Planck distribution • at 4999 K: Ra= 100 • At 5001 K: Ra= 89 • Result depends on selection of test samples • Von Kries transformation outdated • U*,V*,W* space outdated, not colour appearance space
Metameric Test Samples • Metameric samples: • CIE Test Sample • Laser printer sample • 2 Ink-Jet printer samples • Rank order of some lamps in case of CIE Test Samples and different metameric matches
CIE TC 1-33 • Try to use a colour apperance model • As progress for CAM was slow: update for post 1976 basic colorimetric knowledge: • New test samples • Von Kries chrom.adapt.transform. Nayatani transformation • Transform to D65 • U*V*W* space L*a*b* space
Proposedcalculation steps- use only a few reference CCTs- not accepted- visual results requested
CIE TC 1-62 report: Nakano • Multispectral images – semantic differential evaluation • Principal component analysis • First factor – colourfullness, low correlation • Second factor – colour fidelity, good corelation
CIE TC 1-62 report: Davis & Ohno • Simulation of 15 test sample appearance for 40 SPDs • Question of gamut area – extreme colour distortions • Proposed metric: Colour Quality Scale
Experiments at Uni.Pannonia (several other lab-s are conducting experiments) • Visual experiments in a double booth • 3 main CCT groups • 2700 K • 4000 K • Lamps: • Incandewscent • Fluorewcent • RGB- and p-LEDs
Colour appearance in case of incandescent lamp and LED Incandescent LED
Correlation coefficients between visually observed and calculated colour differences
Correlation (R value) between visual scaling and CIE 13.2,CIELAB and CIECAM02 based model
Recommendations by TC 1-62 • Use MCC test samples (TC 1-33 recommendation) • Consider task dependent reference illuminants for task dependent Colour Quality Metric • Try CIECAM02 based colour difference formula • Take preference, visual clarity into consideration
Current activity on colour quality • Colour fidelity • Colour preference • Colour harmony distortion • Colour discrimination • Arousal by colour • Visual comfort
Results of the simulation on CRT monitor Ra versus Visual scaling for two pictures „illuminated” with a number of sources, transformed to the same white point.