Download
1 / 18
180 likes | 292 Views
Part II: Discriminative Margin Clustering. Joint work with: Rob Tibshirani, Dept of Statistics Patrick O. Brown, School of Medicine Stanford University. Gene Expression. Micro-array technology Find expression values of all genes in a tissue

E N D
Part II:Discriminative Margin Clustering Joint work with: Rob Tibshirani, Dept of Statistics Patrick O. Brown, School of Medicine Stanford University
Gene Expression • Micro-array technology • Find expression values of all genes in a tissue • Expression pattern of genes related to characteristics of tissue type • Gene expression iscombinatorial: • Many factors need to combine for expression of a gene • Combinations of expressions lead to certain phenotypes • Poorly understood
Feature Sets for Tumors • Set of genes with higher expression in a cancer type compared to every normal tissue type in the body • Combinatorial gene expression signature • Potential use in diagnostics and drug treatments • If these genes encode cell surface proteins… • … can target them using antibodies • Kills tumor cells • Does not harm normal cells
Feature Set Definition Convex combination of genes which gives maximum separation in expression values Constraint: w1+w2 = 1 w1x+w2y Expression value for Gene y Tumor t Around 100 samples Margin m Normal Set N Expression Value for Gene x
Computing the Feature Set Definition naturally extends to collections of tumor samples
Example w1= 0.5 w2= 0.5 Margin = 100 – 30 = 70
Contrast with Previous Work • Previous work focused just on classifiers: • Separating tumor class from corresponding normal class • Separating tumor from all other tumor tissues • Linear and quadratic Support Vector Machines [Brown et al. , Moler et al. , Ramaswamy et al. , Su et al., Grate et al.] • Problem: Many cancers have poorly understood subtypes • We focus on two combined aspects: • Classifiers separating tumor from all normal tissue classes • Clustering tumors based on this paradigm of separation
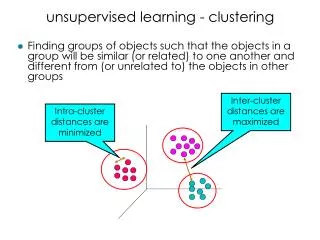
Traditional Clustering • Cluster tissues based on similarity of gene expression patterns • Similar tissues have correlated gene expressions [Eisen, et al. PNAS 1998] • Problem: Genes driving the clustering • Large classes of genes that are all regulated together • Cell cycle and cell proliferation • Protein biosynthesis and cell growth • Respiration • We need to weight these gene classes appropriately
Our Results • Feature sets for tumor samples very small • Picks only one from a correlated set of genes • Genes with different functions expressed in different normal tissues • Hierarchically cluster tumor samples: • Similarity metric for two tumor sets = Combined Margin • Tumor samples with similar feature sets group together • Identify natural clusters of tumor samples • Construct feature sets for each cluster: • Biological significance
Clustering: Hardness • Given: • Set of n tumors • Margin M • Find largest tumor subset with margin M • Problem is n1- hard to approximate • Reduction from maximum clique problem
Clustering: Algorithm G F m2 m1 H Gene y E Tumors Margin m2 A A B C D G F H E D B C Margin m1 Normal Gene x
Cluster Boundaries • Each node in tree labeled with combined margin of tumor samples in sub-tree • Margin reduces as we move up the tree • Chop tree at a chosen margin cut-off • Sub-trees are the clusters • Breast cancer samples group into three clusters: • ERBB2 (ERBB2 and GRB7) • Luminal A type (ESR1, NAT1 and GATA3) • Basal cell type(?) (Keratin, Fibrillin and Fibronectin)
Properties of Feature Sets • Feature set for a tumor cluster: • Has at most 20 genes • Most of the weight concentrated on a few genes
Quality of Clustering • Random partitioning of tumor samples: • Divide tumor samples randomly into training and test groups • Cluster training group • Find cluster with best feature set margin for test sample • Label the sample with the tumor type for that cluster • Classifies unknown tumor samples accurately • At least 75% accuracy in categorizing test samples • At least 90% accuracy for CNS, Breast, Kidney, Ovary and Prostate cancers
Discussion • Small feature sets for a tumor class: • Based only on discriminating it versus normal tissues • Property: Also discriminates it from other tumor classes • Highly expressed genes unique to the tumor class • Biological validation of our method: • ERBB2 and ESR1 can be targeted by monoclonal antibodies • Some of the most effective treatments for breast cancers • AMACR is recently recognized prostate cancer marker • Function not very well understood • MSLN is a well studied ovarian cancer marker
Expanding Feature Sets • Consider weighted combinations which have close to optimal margin • Let optimal margin = M • P() = Polytope of feature sets with margin M - • Find weight vector with min Euclidean norm in P() • Intuition: • Manhattan norm of any weight vector = 1 • Minimizing Euclidean norm spreads the weights • Around 100 genes in feature set
Genes in Larger Feature Sets • Genes with similar expression patterns: • Example:ERBB2and GRB7 • Genes expressed across cancer types: • Not very strongly expressed • Do not drive the clustering • Example: Proliferation and cell cycle related genes • C20ORF1, CENPF, NUF2R, TOPK, L2DTL, KNSL1, … • Example: Possible alterations to chromosome 22 • PRAME
Future Work • Identify cell surface proteins in feature sets • Possible use in chemotherapy and diagnostics • Findings for Ovarian and Pancreatic cancers being tested in the laboratory • Identify genes highly expressed across cancer types: • Examples: TFAP2A, ADAM12 and LOX • Biological significance? • Succinct representations for biological functions: • Examples: Cell cycle, respiration, … • Applications in clustering and modeling gene expression