Download
1 / 16
160 likes | 399 Views
Durham. A Study of Crime Rates from the Past Decade – By Willson Buchanan. Durham County Statistics. Population has increased from 180,697 in 2000 to 221,675 in 2009 Persons below poverty level in 2008: 13.8% or 30,591 people 13.4% or 28,557 people Average in NC: 14.6 %

E N D
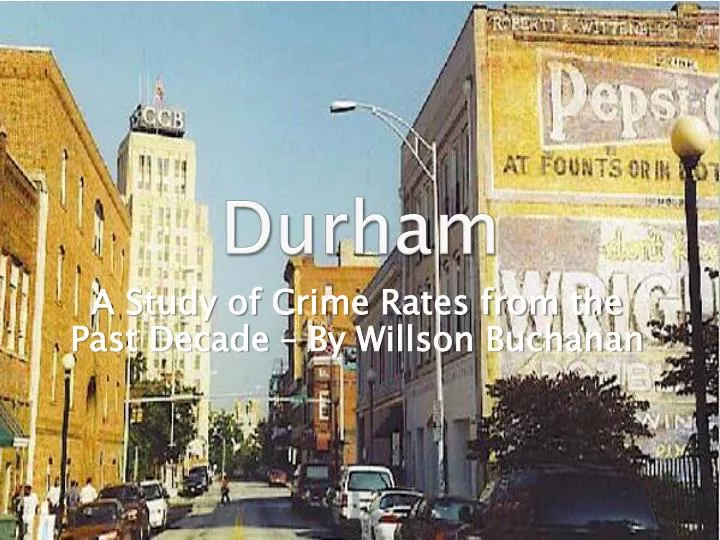
Durham A Study of Crime Rates from the Past Decade – By Willson Buchanan
Durham County Statistics • Population has increased from 180,697 in 2000 to 221,675 in 2009 • Persons below poverty level in 2008: 13.8% or 30,591 people • 13.4% or 28,557 people • Average in NC: 14.6% • Median income in 2008: $51,292
A Safe Place to Live? • Highest Property Crime Rate in the State • Burglary • Larceny • Motor Vehicle Theft • Arson • One of the Highest Violent Crime Rates in the State • Murder • Rape • Robbery • Aggravated Assault • Highest Overall Crime Rate in North Carolina • Not the highest amount of crimes, just the most per person
Property Crime Locations 2006 2009
Violent Crime Locations 2006 2009
Rate TrendsThese Rates are computed by number of crimes per 100,000 people
Crime Rates in Minor Counties in NC Lenoir County Avery County
Crime Rates in Major Counties in NC Mecklenburg Guilford
The Cause? • The Police? • Unemployed Persons? • Self-Improvement?
Police • Increase of 46,392 people in Durham from 2000 to 2009, a 20.8% increase • North Carolina averaged 26.6% • Total Employees, Fulltime sworn policemen and civilians, increased from 555 to 608 • Result? • In 2000 there were 478 citizens for every sworn police officer • In 2009 there were 586 Citizens for every sworn police office • Crime has decreased with fewer police officers per citizen…
Unemployment • Increased from 3% to 5% from 2000 to 2003 • Decreased to 3.5% by 2007 • Increased to 8.5% by 2009 • Result • Crime has decreased during a time of economic depression.
City Self-Improvement • The status report in 2007 suggested that the city had been able to: • create 5000 new jobs • create$1 billion dollars in investments • grow tax revenues • improve downtown entertainment • increase road circulation • create new county government facilities • Result • The city has been able to continually improve upon itself during the economic crises. • There are, however, towns and cities that have a decreased amount of crime and are not employing the same techniques as Durham…
Conclusion • There has been an overall decrease in crime in Durham • Fewer Police • Fewer Jobs • But a City model for improvement • There are many more factors that exist in determining the crime decrease • Could it be that the bad guys are in jail? • Canada had a similar unexplained effect without an increase in cops or people in jail… • There isn’t a great explanation yet or proof that points one way or another
Citations • U.S. Census Bureau - http://quickfacts.census.gov/qfd/states/37/37063.html • http://crimereporting.ncdoj.gov/Reports.aspx • Durham Police Department Crime Mapper - http://gisweb.durhamnc.gov/gis_apps/CrimeData/dsp_entryform.cfm • Durham Downtown Master Plan- https://courses.duke.edu/webapps/portal/frameset.jsp?tab_id=_2_1&url=/webapps/blackboard/execute/launcher%3ftype%3dCourse%26id%3d_94796_1%26url%3d • http://tierneylab.blogs.nytimes.com/2007/02/16/the-crime-mystery/