Download

1 / 52
540 likes | 776 Views
9. CHAPTER. Profitability Analysis. Analyzing Profitability. Focus of Profitability Analysis. Profitability analysis is a key part of financial statement analysis All financial statements are pertinent to profitability analysis

E N D
9 CHAPTER Profitability Analysis
Analyzing Profitability Focus of Profitability Analysis Profitability analysis is a key part of financial statement analysis All financial statements are pertinent to profitability analysis Emphasis of profitability analysis is on the income statement
Analyzing Profitability Focus of Profitability Analysis • Profitability analysis helps address questions such as: • What is a company’s relevant income measure? • What is the quality of income? • What income components are important for forecasting? • How persistent are income and its components? • What is a company’s earning power?
Analyzing Profitability Measuring Income • Income is defined as revenues less expenses over a reporting period • This definition does not yield a unique amount because of: • Estimation Issues • Accounting Methods • Incentives for Disclosure • Diversity across Users
Analyzing Profitability Measuring Income--Estimation Issues Income measurement depends on estimates of future events These estimates require: • Use of judgment and probabilities • Allocations of revenues and expenses across periods • Prediction of the future usefulness of many assets • Forecasts of future obligations
Analyzing Profitability Measuring Income--Estimation Issues Management discretion is part of income measurement Estimates of skilled and experienced professionals Some consensus (less variability)
Accounting standards governing income measurement Analyzing Profitability Measuring Income--Accounting Methods Professional experience Social Influences Regulatory agendas Political pressures Business happenings Academic research
Analyzing Profitability Measuring Income--Accounting Methods Methods reflect the outcome of numerous factors, including compromises Discretion is permitted to accommodate different business circumstances Methods geared toward “general-purpose” financial statements
Analyzing Profitability Measuring Income--Incentives for Disclosure Ideally: Financial statements fairly present transactions and events Accounting is neutral—not affecting how transactions and events are perceived Methods chosen that are most applicable to the circumstances Relevant information is disclosed—favorable and unfavorable
Analyzing Profitability Measuring Income--Incentives for Disclosure Reality: Each of us possess opinions--we see the world from different perspectives Managers bring strong views to the table Managers feel pressures of competition and society Directors expect results Shareholders concentrate on the bottom line Creditors want safeguards Financial analysts dislike surprises Accounting preparers and auditors demand acceptable practices
Analyzing Profitability Measuring Income--Incentives for Disclosure Result: “Acceptable” methods, not necessarily “appropriate” methods
Analyzing Profitability Measuring Income--Diversity Across Users • Financial statements are general‑purpose reports serving diverse needs of many users • Diversity of views implies an analysis uses income as an initial measure of profitability • Use available information adjust income measurement consistent with one’s objectives
Analyzing Revenues Two-Phase Analysis of Income Analysis of income and its components involves two phases 1. Analysis of accounting and its measurements Purpose: To apply knowledge of accounting to yield a measure of income, and its components, consistent with the analysis objectives 2. Applying analysis tools to income (and its components) and interpreting the analytical results Purpose: To apply analysis tools to aid achieve the analysis objectives—such as income forecasting and estimating earning power
Analyzing Revenues Revenue Sources Analysis of revenues (sales) helps address questions such as: What are the major sources of revenue? How persistent are revenue sources? How are revenues, receivables, and inventories related? When is revenue recorded? How is revenue measured?
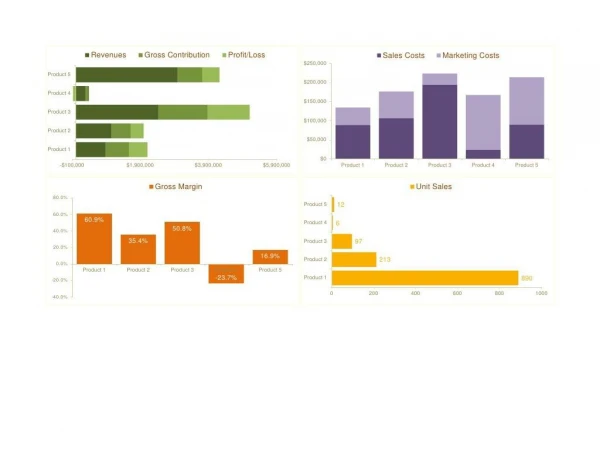
Analyzing Revenues Revenue Sources Knowledge of major sources of revenues is important to profitability analysis Each market and product line often has its own growth pattern, profitability, and future potential Common-size analysis of revenues shows the percent of each major class of revenue to its total Graphical analysis is a useful tool to interpret the sources of revenues
Analyzing Revenues Revenue Sources Diversified Companies present special challenges • Different segments usually experience varying rates of profitability, risk, and growth • Asset composition and financing requirements of segments often vary • Evaluation, projection, and valuation of income is aided by segment analysis • Segments share characteristics of variability, growth, and risk • Income forecasting benefits from forecasts by segments • Must separate and interpret the impact of individual segments
Analyzing Revenues Revenue Sources Full disclosure by segments is rare because of: • Difficulties in separating segments • Management’s reluctance to release information that can harm its competitive position
GAAP Analyzing Revenues Revenue Sources Reporting requirements exist for: • Industry segments • International activities • Export sales • Major customers
GAAP Analyzing Revenues Revenue Sources Reporting requirements consider a segment significant if its sales, operating income, or identifiable assets comprise 10 percent or more of their relevant totals Notes: Combined sales of all segments reported must be at least 75 percent of the company’s total sales Ten segments is viewed as a practical limit on the number of segments reported
Analyzing Revenues Revenue Sources Information disclosed for each segment: (1) sales—both intersegment and to unaffiliated customers (2) operating income—revenues less operating expenses (3) identifiable assets (4) capital expenditures (5) depreciation, depletion, and amortization Similar disclosures are required for international operations and export sales (except capital expenditures and depreciation) Revenues from a single customer are disclosed if they comprise 10 percent or more of total revenues
Analyzing Revenues Revenue Sources Limitations of segment data: • Difficult to define segments • Arbitrary allocations of costs across segments
Analyzing Revenues Revenue Sources Useful applications of segment data include: Analysis of sales growth Analysis of asset growth Analysis of profitability
Analyzing Revenues Persistence of Revenues Persistence (stability and trend) of revenues is important to profitability analysis Analysis tools for assessing persistence in revenues include: (1) trend percent analysis (2) evaluation of Management’s Discussion and Analysis
Analyzing Revenues Persistence of Revenues--Trend Percent Analysis Revenues for a prior period are set equal to 100 percent Revenues for other periods are compared to it Revenue trends by segments are often: Correlated Compared to industry norms Compared to competitors
Analyzing Revenues Persistence of Revenues--Trend Percent Analysis • Other related measures: • (Auto)correlations of revenues • across periods • Assess sensitivity of revenues to • business conditions • Customer analysis—concentration, dependence, and stability • Revenues’ concentration or dependence on one segment • Revenues’ reliance on sales staff • Geographical diversification of markets
Analyzing Revenues Persistence of Revenues--MD&A Management’s Discussion and Analysis (MD&A) is often useful in analysis of persistence in revenues • Aids in understanding and evaluating period-to-period changes • Report on changes in revenue components • Discloses uncertainties affecting or likely to affect revenues • Explains growth in revenues to prices, volume, inflation, or new product introduction • Reports some forward‑looking information • Discusses trends and forces not evident from financial statements
Analyzing Revenues Key Revenue Relations • Revenues and Accounts Receivable Relation • Bears on: • Earnings quality • Collectibility of receivables
Analyzing Revenues Key Revenue Relations • Revenues and Inventories Relation • Bears on: • Future revenues • Analysis of operations
Analyzing Revenues Revenues Recognition • Profitability analysis must adjust for different revenue recognition methods in: • • Comparative analysis—both temporal and cross-sectional • • Forecasting revenues • Chapter 6 discusses revenue recognition criteria and measurement
Analyzing Costs of Revenues Measuring Gross Profit Gross profit,orgross margin, is measured as revenues less cost of sales All other costs must be recovered from gross profit Any income earned is the balance remaining after these costs Gross profit must finance essential future‑directed discretionary expenditures
Analyzing Costs of Revenues Measuring Gross Profit Gross profits vary across industries depending on factors such as: • Competition • Capital investment • Level of costs that must be recovered from gross profit
Analyzing Costs of Revenues Analyzing Gross Profit Analysis of gross profit directs attention at the factors explaining variations in: • Sales • Costs of sales
Analyzing Costs of Revenues Analyzing Gross Profit Analysis Statement of Changes in Gross Profit Step 1.Focus on year‑to‑year change in volume assuming unit selling price is unchanged—Volume change is multiplied by the constant unit selling price to yield change in sales Step 2.Focus on year-to-year change in selling price assuming volume is constant--Change in selling price is multiplied by the constant volume to yield change in sales Step 3. Focus on joint changes in volume and unit price— Volume change is multiplied by the change in unit selling price to yield net change in sales Step 4.Steps 1 to 3 explain the net change in sales.
Analyzing Costs of Revenues Analyzing Gross Profit Analysis Statement of Changes in Gross Profit—Illustration Year Ended December 31 Year-to-Year Change Item Year 1 Year 2 Increase Decrease 1. Sales ($ millions) $ 657.6 $ 687.5 $ 29.9 2.Cost of sales ($ millions) 237.3245.3 8.0 3.Gross profit ($ millions) $ 420.3 $ 442.2 $ 21.9 4.Units sold (in millions) 215.6 231.5 15.9 5.Sales price per unit (1 ÷ 4) $ 3.05 $ 2.97 $ 0.08 6.Cost per unit (2 ÷ 4) 1.10 1.06 0.04
Analyzing Costs of Revenues Analyzing Gross Profit Analysis Statement of Changes in Gross Profit Year 2 versus Year 1 Analysis of Variation in Sales 1. Change in volume of products sold: Change in volume (15.9) Year 1 unit selling price ($3.05) $ 48.5 2.. Change in selling price: Change in selling price ($0.08) Year 1 sales volume (215.6) 17.2 $ 31.3 3. Combined change in sales volume (15.9) and unit price ($0.08) 1.3 Increase in net sales $ 30.0* Analysis of Variation in Cost of Sales 1. Change in volume of products sold: Change in volume (15.9) Year 1 cost per unit ($1.10) $ 17.5 2. Change in cost per unit sold: Change in cost per unit ($0.04) Year 1 sales volume (215.6) 8.6 $ 8.9 3. Combined change in volume (15.9) and cost per unit ($0.04) 0.6 Increse in cost of sales $ 8.3* Net variation in gross profit $ 21.7* * Differences are due to rounding.
Analyzing Costs of Revenues Interpreting Changes in Gross Profit • Changes in gross profit are often driven by one or more of the following factors: • Increase in sales volume • Decrease in sales volume • Increase in unit selling price • Decrease in unit selling price • Increase in cost per unit • Decrease in cost per unit
Analyzing Costs of Revenues Interpreting Changes in Gross Profit • Identification of factors driving gross profit yields • Improved business strategies • Better assessment of future performance
Analyzing Expenses Tools for Analysis of Expenses Common-size analysis Common‑size income statements express expenses in terms of their percent relation with revenues Traced over several periods or compared with competitors Index number analysis Index number analysis of income statements expresses income and its components in an index number related to a base period Highlights relative changes across time Changes in expenses are readily compared with changes in both revenues and related expenses Operating ratio analysis Operating ratio measures the relation between operating expenses (or its components) and revenues Equals cost of goods sold plus other operating expenses divided by net revenues Interest and taxes are normally excluded from this measure due to its focus on operating efficiency (expense control) and not financing and tax management Useful for analysis of expenses within and across companies
Analyzing Expenses Selling Expenses • Analysis of selling expenses focuses on three areas: • Evaluating the relation between key selling expenses and revenues • Assessing bad debts expense • Evaluating the trend and productivity of future‑directed marketing expenses
Analyzing Expenses Depreciation Expense Relation of depreciation to gross plant and equipment helps reveal changes in the composite rate of depreciation—this is useful in evaluating depreciation levels and in detecting adjustments (smoothing) to income: It is often useful to compute this ratio by asset categories
Analyzing Expenses Maintenance and Repairs Expense Maintenance and repairs expense: • Varies with investment in plant and equipment and with the level of productive activity • Affect costs of sales and other expenses • Comprise both variable and fixed costs • Do not vary directly with sales
Analyzing Expenses Maintenance and Repairs Expense Relation of sales to maintenance and repairs expense, both across companies and time, must be interpreted with care • Analysis and interpretation using this ratio • Is enhanced if we can distinguish between variable and fixed portions of these expenses • Must recognize the discretionary nature of these expenses • Bear on productivity and earnings quality assessments • Impacts asset valuations
Analyzing Expenses Amortization of Special Costs • Expenditure for special costs can be related to and expressed as a percent of: • (1) revenues • (2) net property and equipment • Amortization of special costs can be related to and expressed as a percent of: • (1) revenues • (2) unamortized special costs • (3) net property and equipment
Analyzing Expenses Amortization of Special Costs • Ratios involving special costs are useful in: • Comparison of annual trends in these relations • Analysis of consistency in income reporting • Evaluation of income for two or more competitors
Analyzing Expenses General and Administrative Expenses • Most are fixed—such as rent and salary • Tendency for increases, especially in prosperous times
Analyzing Expenses General and Administrative Expenses • Analysis of G&A should focus on: • Trend in these expenses • Percent of revenues they consume
Analyzing Expenses Financing Expenses • Most are fixed—exception is variable-rate interest • Most creditor financing is eventually refinanced and not removed • Interest expense often includes amortization of a premium or discount
Analyzing Expenses Financing Expenses Average effective interest rate: Useful tool for: • Analysis of the cost of borrowed money • Credit standing • Comparisons across years and companies • Assessing sensitivity to interest rate changes
Analyzing Expenses Income Tax Expenses Income tax expenses: Reflect a distribution of profits between a company and governmental agencies Usually comprise a substantial portion of a company’s pre-tax income
Analyzing Expenses Income Tax Expenses • Effective Tax Rate (ETR) • ETR (also called tax ratio) reflects • relation between the income tax • accrual and pre‑tax income