Download
1 / 9
90 likes | 255 Views
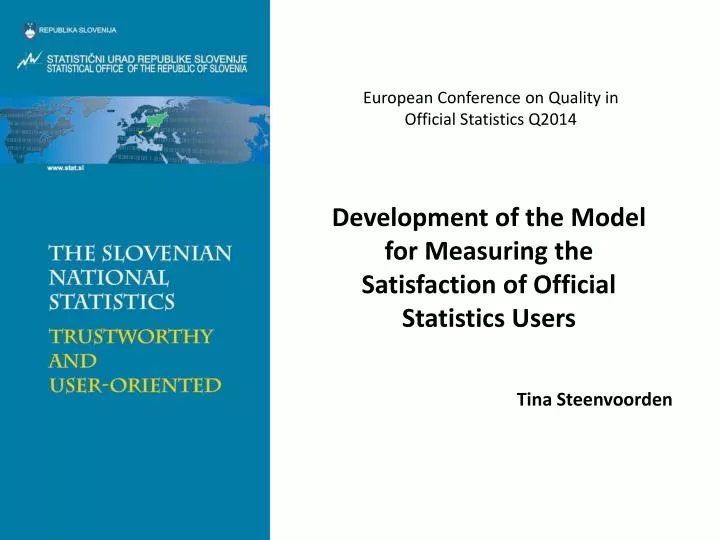
European Conference on Quality in Official Statistics Q2014. Development of the Model for Measuring the Satisfaction of Official Statistics Users. Tina Steenvoorden. Introduction. U ser -oriented approach of NSI‘s European Statistics Code of Practice

E N D
European Conference on Quality in Official Statistics Q2014 Development of the Model for Measuring the Satisfaction of Official Statistics Users Tina Steenvoorden
Introduction • User-oriented approachof NSI‘s • European Statistics Code of Practice • ESS Standard for Quality Reports (ESQRS) • Euro SDMX metadata structure for the exchange of reference metadata (ESMS) • Developmentof the methodology in this field is slow and the exchange of knowledge is limited
Developmentof a model • Reviewofrelevanttheoretical basis for measuring users’ satisfaction from related fields of research: • national customer satisfaction indices (ACSI) • measuringthe quality of services, • measuring satisfaction with websites • measuring satisfaction in the public sector • Model formeasuringthesatisfactionofofficialstatisticsuserswasdefined
PercievedQualityofOfficialStatisticsData Recommendations and Complaints OverallUserSatisfaction Assessment of Direct Contact Trust Model for Measuring the Satisfaction of Official Statistics Users at SURS WebsiteEvaluation PercievedQualityofGoods PercievedQualityofServices
Usersatisfactionsurvey at SURS • Developmentofmeasurmentscales, cognitivetests, pilot study • On-line survey • Out of 11 565 invited users, 2 680 took part in the survey. The overall responseratewas 23%. • 60% female and 40% male users
0,36 Data quality Trust 0,72 0,14 0,80 0,72 Overall satisfaction Direct contact 0,22 0,92 Recommendations/ complaints 0,05 0,60 Website 0,16 Parameter estimates (standardized coefficients) 0,67
Groupcomparison Well-satisfiedusers(36 %): more frequentusers, more experiencedusers, more oftenvisitingwebsite; more oftenusingdataforpersonalpurposes. Satisfiedusers (44 %): usedatafor a longer time, more oftenusingdataforstudy or researchpurposes. Less-satisfiedusers (20 %): usedatalessoften, new/freshusers, visitingwebsite a coupletimes a year; more oftenusingdataforbussinesspurposes.
Conclusion • The aggregated results of the survey were published on SURS’s website, along with a special release on the website to inform the users about the results. • The results have been presented at the management board meeting and the meeting of the Statistical Council, and a more detailed analysis is available on the intranet site for all employees. • Based on the results, the main improvement action has been the thorough renovation of SURS’s website that is still under construction. • Afterthe successful implementation of the new website, the survey will be repeated.