Download
1 / 38
380 likes | 502 Views
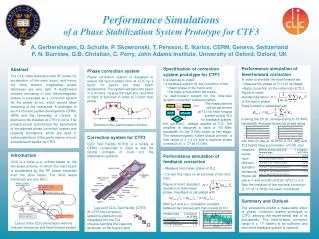
Detecting Recurrent Phase Behavior under Real-System Variability. Canturk ISCI Margaret MARTONOSI. E1. E2. E3. E4. E5. GATE. ON. Phase Analysis & Real Systems. Phases: Self-similar, mostly recurrent, execution regions. Useful for characterization, dynamic-adaptive management.

E N D
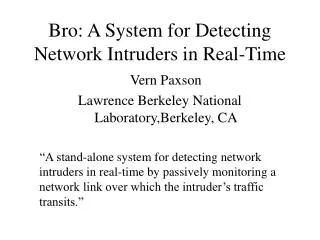
Detecting Recurrent Phase Behavior under Real-System Variability Canturk ISCIMargaret MARTONOSI
E1 E2 E3 E4 E5 GATE ON Phase Analysis & Real Systems • Phases: Self-similar, mostly recurrent, execution regions • Useful for characterization, dynamic-adaptive management • How to identify phase recurrences when real-system effects make them inexact replicas? Canturk Isci - Margaret Martonosi
Underlying Research Questions • What are the types and extent of system-induced variations? • How do phases manifest themselves with real-system effects? • Can we extract recurrent behavior in spite of these variations?If so, how? Canturk Isci - Margaret Martonosi
Background: Power and Phases • Runtime processor power monitoring and estimation [Micro’03] • Sample PMCs to estimate powers for 22 chip components • Real measurement feedback for tuning and verification • Workload power phase behavior with power vectors [WWC’03] • Consider power estimations as power vectors • Characterize “power phases” based on vector similarity Canturk Isci - Margaret Martonosi
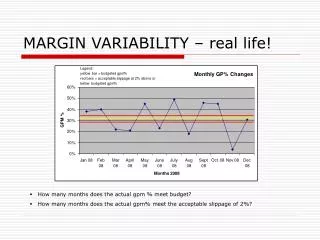
Variability in Real-System Runs • Initial idea was to look at phase distributions of apps and use some signature analysis to detect/predict phases • HOWEVER: • Multiple runs inevitably exhibit different behavior • Quantities & durations varyPhase distributions vary Metric Variability Time Variability Canturk Isci - Margaret Martonosi
Underlying Research Questions • What are the types and extent of system-induced variations? • Metric variability • Time variability • How do phases manifest themselves with real-system effects? • Can we extract recurrent behavior in spite of these variations?If so, how? Canturk Isci - Margaret Martonosi
Real-System Variability Effects on Phases Metric t Ideal Glitch Gradient Shift Mutation Time Dilation Canturk Isci - Margaret Martonosi
Real-System Variability Effects on Phases • A direct apples to apples comparison of phase signatures is not very relevant in real world! Ideal FINAL Glitch Gradient Shift Mutation Time Dilation Canturk Isci - Margaret Martonosi
Underlying Research Questions • What are the types and extent of system-induced variations? • How do phases manifest themselves with real-system effects? • Can we extract recurrent behavior in spite of these variations?If so, how? Canturk Isci - Margaret Martonosi
Improving Phase Analysis Using Transitions Metric Ideal t Metric Final t Canturk Isci - Margaret Martonosi
Improving Phase Analysis Using Transitions Value Based Phases (VBP) • Value based phase representations do not show good correlation 3 2 2 1 t 6 5 4 3 2 2 1 t Canturk Isci - Margaret Martonosi
Our Proposed Solution with Transitions Transition Based Phases (TBP) • Tracking phase transitions rather than phase sequences is more useful in detecting recurrent behavior 1 1 1 00…0 00…0 00…0 00…0 t 1 1 1 1 1 1 00…0 00…0 00…0 00…0 00…0 t Canturk Isci - Margaret Martonosi
Apply near-neighbor blurring Our Transition-Guided Detection Framework Benchmark run #1 Benchmark run #2 Sample PMCs to form 12D vectors Vector stream #1 Vector stream #2 The INTRO Identify Transitions TBPinit #1 TBPinit #2 Apply glitch/gradient filtering TBPgg #1 TBPgg #2 TBPggN #1 Apply cross correlation Match ⇒Peak at best alignment Mismatch ⇒ No observable peak Canturk Isci - Margaret Martonosi
GLITCHES: Initial Transitions: 0 0 0 0 0 0 1 1 0 0 0 0 0 0 0 0 0 0 1 1 1 1 0 0 0 0 0 0 0 0 0 1 1 1 1 1 1 1 1 1 0 0 0 0 Refined Trans-ns: 0 0 0 0 0 0 0 0 0 0 0 0 0 0 0 0 0 0 0 0 0 0 0 0 0 0 0 0 0 0 0 0 0 0 0 0 0 0 0 0 0 0 0 0 GRADIENTS: Initial Transitions: 0 0 0 0 1 1 1 1 0 0 0 0 0 0 0 0 0 0 1 1 1 1 0 0 0 0 0 0 0 0 0 1 1 1 1 1 1 1 1 1 0 0 0 0 Refined Trans-ns: 0 0 0 0 1 0 0 0 0 0 0 0 0 0 0 0 0 0 1 0 0 0 0 0 0 0 0 0 0 0 0 1 0 0 0 0 0 0 0 0 0 0 0 0 Sampling Effects: Glitches & Gradients • Nothing happens without disturbances Glitches • Glitch: Instability where before & after are same Spurious transitions • Nothing happens instantaneously Gradients • Gradient: Instability where before & after are different A single true trans-n • Glitch/Gradient Filtering: • Very simple: no consecutive transitions Canturk Isci - Margaret Martonosi
Strong peak indicates good match! Low peak signifies mismatch! Time Shifts • Cross-correlation of binary sequences shows the highest matching of signatures at the best alignment • Ex: Matching and Mismatch cases, and “The Peak” Mismatch case: Gcc-Equake Matching case: Gcc1-Gcc2 Canturk Isci - Margaret Martonosi
1 1 1 1 1 0 0 0 0 0 0 0 0 0 0 0 0 0 0 0 0 0 0 0 0 0 0 0 0 0 0 0 0 0 0 0 0 0 0 0 0 0 0 0 1 Time Dilations • Observation: Dilations exist as small jitters (few samples) • Proposed Solution: “Near-Neighbor Blurring” • Blur edges slightly Consider transitions as distributions around their actual locations • Tolerance: Spread of this distribution, [t-x, t+x] samples • Ex: Matching improvement with tolerance=2: run1 1 Mismatch! t run2 t Canturk Isci - Margaret Martonosi
1 1 1 1 1 .7 .7 .7 .7 .7 .7 .3 .3 .3 .3 0 0 0 0 0 0 0 0 0 0 0 0 0 0 0 0 0 0 0 0 0 0 0 0 0 0 0 0 0 0 0 0 0 0 0 0 0 0 0 1 Time Dilations • Observation: Dilations exist as small jitters (few samples) • Proposed Solution: “Near-Neighbor Blurring” • Blur edges slightly Consider transitions as distributions around their actual locations • Tolerance: Spread of this distribution, [t-x, t+x] samples • Ex: Matching improvement with tolerance=2: run1 Match! 1 t run2 t Canturk Isci - Margaret Martonosi
Apply near-neighbor blurring Our Transition-Guided Detection Framework Benchmark run #1 Benchmark run #2 Sample PMCs to form 12D vectors Vector stream #1 Vector stream #2 The SUMMARY Identify Transitions TBPinit #1 TBPinit #2 Apply glitch/gradient filtering TBPgg #1 TBPgg #2 TBPggN #1 Apply cross correlation Match ⇒Peak at best alignment Mismatch ⇒ No observable peak Canturk Isci - Margaret Martonosi
Results • How do we quantify phase recognition quality? • Matching Score: • Range of values ≥ 0 • Higher is better Canturk Isci - Margaret Martonosi
Results • Detection Results: (green: highest match; red: highest mismatch) Canturk Isci - Margaret Martonosi
0 detect threshold P{hit} = 1P{false alarm} = 1 Desired operating point P{hit} ~ 1P{false alarm} ~ 0 Very high detect threshold P{hit} = 0P{false alarm} = 0 Receiver Operating Characteristics • Best detection scheme (tolerance=1) achieves 100% hit detection with <5% false alarms. • (Using the same threshold for all apps!) Canturk Isci - Margaret Martonosi
Comparison: TBP Outperform VBP • In all cases transitions perform better • In almost all cases near-neighbor blurring improves detection Canturk Isci - Margaret Martonosi
Conclusions • Detecting phase behavior on real systems has interesting challenges resulting from system induced variability • Phase transition information improves detection capabilities • TBP show 6X better detection capabilities than VBP • Supporting methods, such as Glitch/Gradient Filtering and Near-Neighbor Blurring improve detectability of transition signatures • Near-neighbor blurring with tolerance=1 achieve 100% recurrence detection with <5% false alarms • Resulting infrastructure can enable a range of phase-oriented system adaptations! Canturk Isci - Margaret Martonosi
Thanks! Canturk Isci - Margaret Martonosi
BACKUPS • 0.5) How much noise, how much variation? • 1) Variation in time sequences of phase distributions for two gcc runs; recurrent phases with ammp • 2) Refined transition counts for different thresholds • 3) Advantages with Power/PMC Vectors • 4) Threshold vs. Hits & Misses with Tolerance=1 • 5) How about instr-n based sampling/control flow-based approach? • 6) What’s the source of variability? • 7) Glitches/Gradients vs. sampling frequency? • 8) Use of this framework? • 9) Multithreaded / OLTP like benchmarks? • 10) SMT/CMP/multiprogramming environment? Canturk Isci - Margaret Martonosi
Gap Vortex Gzip Vpr Gcc Crafty Measured Modeled 0.5) Noise vs. Variations Stable Apps Vpr/Crafty change very little, Variable ones change much more Canturk Isci - Margaret Martonosi
1)Phase Distributions Along Execution Timeline for 2 Runs of Gcc Canturk Isci - Margaret Martonosi
1) Recurrence Example with Ammp • Although obvious to the eye, comparing phase sequences directly does not reveal the recurrence clearly! Canturk Isci - Margaret Martonosi
2) Refined Transitions for Different Thresholds Gcc Equake Canturk Isci - Margaret Martonosi
3) Advantages with Power/PMC Vectors • Direct relation to actual processor power consumption • Acquired at runtime • Identify program phases with no programmatical knowledge of application Canturk Isci - Margaret Martonosi
4) Threshold vs. Hits & Misses with Tolerance=1 100% hits with < 5% false alarms, for threshold: 3/14=0.21 – 4/14=0.29 Canturk Isci - Margaret Martonosi
5) How about inst-n based sampling / control flow-based approaches? • We have tried 3 methods: • OS/USR counting with PMCs • Doesn’t eliminate variability • Binding to threads in sampling • Didn’t solve variability/registration problems • Dynamic instrumentation with Pin • Got back to perfect repeatability • Lost actual benchmark execution behavior that flows thru the processor • PC sampling doesn’t solve variability if we simply sample PCs every 1ms or so. (Application execution time varies) • Sampling at fixed instruction counts is for a specific PID makes it deterministic • Has its downsides with uncontrolled timing behavior and not being able to bind to flow thru processor Canturk Isci - Margaret Martonosi
6) What’s the Source of Variability? • We don’t have perfect, classified answer yet. • Maybe Pin/atom can help • - Different locality at different runs • - Intensity of spontaneous system processes • - Inexact memory access patterns / swaps • - Different cache/tlb/bht etc states Canturk Isci - Margaret Martonosi
7) Glitches/Gradients vs. Sampling Frequency • Reducing frequency smoothes glitches, BUT dithers gradients More sluggish, LPF’ed response • Also smoothes actual phase changes • We use 100ms to meet limitations of high frequency corner: • No observable perturbation to actual execution • Limited by RS232 speed • Close lower bound to acquire 3-4 DMM samples Canturk Isci - Margaret Martonosi
8) What’s the Use of This? • First, this is a GENERIC recurrence detection under variability system!! • Can use to detect/predict phases with specific features: • Memory boundness • Hotspots • Can be stretched to security/reliability: • Matching signatures with PIDs • Specific promising avenues: • CMP workload balancing by signatures power • Activity migration in the case of hotspot signatures • **DVFS at experienced signatures** • Need help from BBVs under phase behavior changes with taken actions!! Canturk Isci - Margaret Martonosi
9) Multithreaded/OLTP Like Benchmarks? • No fundamental analysis problem as we don’t try to bind to processes • Some of the experimented ones: • Mozilla, Xmms, Mplayer • FLAT power behavior Not interesting • Need more infrastructure work to get OLTP like applications running on our platform • Interesting follow-on to see variability of these apps Canturk Isci - Margaret Martonosi
10) SMT/CMP/Multiprogramming Environments • Don’t have the SMT/CMP platforms hooked up for multimeter (yet) • SMT should be similar, as long as the multi-app behavior is somewhat repeatable • CMP less clear, one PMC set & power measurement per core? Overall per chip? • We have tried multiprogramming on our P4: • Memory intensive apps create too much swapping/thrashing for the behavior to be somewhat repeatable. • Not useful for phase detection • How deterministic is Task switching? Canturk Isci - Margaret Martonosi
OLD/EXTRA Slides Canturk Isci - Margaret Martonosi