Download
1 / 63
630 likes | 752 Views
Trial Objectives. Superiority, Non-inferiority, and Equivalence. Questions of Interest. Is the new treatment better than the control treatment that I am using now? (superiority trial)

E N D
Trial Objectives Superiority, Non-inferiority, and Equivalence
Questions of Interest • Is the new treatment better than the control treatment that I am using now? (superiority trial) • If it is not better, is the new treatment as good (not unacceptably non-inferior) as the control treatment that I am using now? (non-inferiority trial) • Can I use the new treatment and the control treatment interchangeably? (equivalence trial) Non-inferiority and equivalence trials are usually considered when there is an active control.
Definitions (ICH Guidelines – E9) • Superiority trial – a trial with the primary objective of showing that the response to the investigational product is superior to a comparative agent (active or placebo control). • Equivalence trial – a trial with primary objective of showing that the response to two or more treatments differs by an amount which is clinically unimportant (active control). • Non-inferiority trial – a trial with the primary objective of showing that the response to the investigational product is not clinically inferior (or not unacceptably inferior) to a comparative agent (active or placebo control but usually active) – very common in the regulatory setting either for a new treatment or for a new label indication.
FDA Guidance • “The objective of a non-inferiority trial is to show that any difference in the effectiveness of the two drugs is small enough to allow a conclusion that the new drug is not substantially less effective than the active control.” • “FDA considers the selection of a non-inferiority margin to be the single greatest challenge in designing, conducting, and interpreting non-inferiority trials…If a non-inferiority margin is incorrectly calculated and set to large, a drug that is not effective may appear to be effective; if the margin is too small, an effective drug may appear ineffective.” GAO-1-798 Evidence from Clinical Trials
Reasons for Active Controls • An active treatment (comparator) with established efficacy exists. • If superiority can be established, the standard of care is improved. • While a short-term study with a placebo control might be ethical, if the outcome is morbidity/mortality, a trial with use of a placebo is not ethical if an accepted standard of care treatment exists (recall papers by Temple and Ellenberg).
The Number and Type of Active Comparator Studies Vary by Sponsor (Commercial versus Non-Commercial) • Among published reports of trials between June 2008 and September 2009 in major medical journals, 97/212 (46%) used an active comparator. • 36/108 (33%) with commercial sponsors and 61/104 (59%) with non-commercial sponsors. • 18/36 (50%) of active controlled commercial trials were non-inferiority versus 5/61 (8%) of non-commercial trials. JAMA 2010; 303:951-958
Examples – Non-Inferiority - 1 • Safety: Is a new vaccine for pertussis (whooping cough) that has an improved safety profile as effective in preventing whooping cough as the currently licensed vaccine? • Ease of use: Is a new oral anticoagulant non-inferior to warfarin for stroke and systemic embolism among patients with atrial fibrillation? (N Engl J Med 2011)
Examples – Non-Inferiority - 2 • Treatment duration: Is a short course of treatment for latent TB infection (3 months of INH plus rifapentine) as effective as 9 months of INH in preventing active TB? (N Engl J Med 2011) • Cost: Is an inexpensive alternative to ranibizumab called bevacizumab non-inferior for visual acuity among patients with age-related macular degeneration? (N Engl J Med 2011)
Example - HIV Trial:Abacavir-Lamivudine-Zidovdine vsIndinavir-Lamivudine-ZidovudineJAMA 2001;285:1155-1163. “The study was powered to assess treatment equivalence for the primary endpoint (i.e., a plasma HIV RNA level <= 400 copies/mL at week 48 for the intent- to-treat population). For the primary end point, treatments were considered equivalent if the 95% confidence interval was within the bound -12% to 12%.”
Motivation Evaluating New Treatments in for Non-Inferiority and Equivalence Trials New Treatment • Costs less • More convenient to use (e.g., short course of prophylaxis for TB, no blood tests as for warfarin) • Lower risk of side effects (e.g., pertussis vaccine) But is it as effective?
Superiority and Non-Inferiority in One Trial(Usually concurrent placebo arm is absent, but this may be practical in some short-term studies) Randomize Drug A Control Drug B Experimental Placebo Superiority Non-inferiority
Effect of Hypericum perforatum (St. John’s Wort) in Major Depressive Disorder Randomize Sertraline Active Control St. John’s Wort Experimental Placebo Control Neither sertraline or St. John’s Wort was significantly different from placebo in this 8 week study. The authors noted “without a placebo, hypericum could easily have been considered as effective as sertraline…” JAMA 2002; 287:1807-1814.
In the absence of a concurrent placebo, have to provide assurance that the active control would have been superior to placebo, if it had been used, and the test treatment would have beat placebo had it been used (indirect inference).
Non-inferiority or Equivalence Trials:Key Features • Efficacy of reference or control treatment (anchor) must be clearly established (control is better than nothing). • Target population and outcome measures must be similar to the trial that established efficacy of control (constancy assumption). • Margin of non-inferiority/equivalence must be a priori stated, clinically relevant, and chosen to ensure new treatment is better than “imputed” nothing (non-inferiority margin).
Assay Sensitivity and Constancy are Critical Assumptions in Interpreting Non-inferiority and Equivalence Trials Assay Sensitivity (def.) – ability to demonstrate a difference between active and inactive treatments • Can you assume that the standard treatment (active control) is effective? • How do you tell the difference between a good trial that establishes two active treatments to be similarly effective from a bad trial that incorrectly claims similarity? • External evidence: historical data that the control treatment is effective • Internal evidence : a high quality trial Constancy (def.) • Historical data showing that the control treatment is effective (better than placebo), holds in the setting of the current non-inferiority trial Hung and O’Neill, Encyclopedia of Clinical Trials
Historical Evidence Concerning Efficacy of Active Control and Defining the Non-Inferiority or Equivalence Margin • One trial • Meta-analysis or overview of trials (need to be cognizant of “file-drawer” problem) • Point-estimate or lower bound of 95% CI • Retention of certain fraction of superiority of active control over placebo (e.g., 50%) • True probability of event for active control and placebo are 20% and 30% • Show probability of event with new treatment is smaller than 25% (a difference, or non-inferiority margin, between new treatment and active control of 5%) Would like to convince people that if you had used placebo you would have won!
General Problems in Determining Non-Inferiority Margin • What is “unacceptably inferior” or an acceptable level of non-inferiority – often in the eyes of the beholder! • Multiple outcomes are at play – non-inferiority margins are typically defined for the primary endpoint but many outcomes may be considered. • Constancy assumption: same endpoint, duration of follow-up as trial(s) that established efficacy of active control. • The margin assumes we know “true” effect of active control and often there is substantial variability. • In some cases, there are multiple choices for active control.
Another Problem • Suppose the control arm (e.g., standard of care) is shown to be inferior to another treatment – what is the relevance of showing your drug is not too much worse than a drug which is inferior to another? • See Fleming T and Emerson S, N Engl J Med, 2011. • Rivaroxaban found inferior to wafarin for atrial fibirallation (Patel M et al, N Engl J Med 2011) • Another recently licensed drug, dabigatran, was found to be superior to wafarin (Connolly S et al, N Engl J Med, 2009)
How do you prove two treatments are equal? Cannot prove HO: Δ=0
“It is never correct to claim that treatments have no effect or that there is no difference in the effects of treatments. It is impossible to prove … that two treatments have the same effect. There will always be uncertainty surrounding estimates of treatment effects, and a small difference can never be excluded… An analysis of 45 reports of trials purporting to test equivalence found that only a quarter set boundaries on their equivalence.” Alderson P, Chalmers I. BMJ 2003:326:1691-8. The non-inferiority/equivalence margin must be specified in the protocol!
Relationship Between SignificanceTests and Confidence Intervals Superiority strongly shown p=0.002 p=0.05 Superiority shown p=0.20 Superiority not shown ControlBetter 0 New Agent Better Treatment Difference
Superiority Trial – ALLHAT:Lisinopril vs Chlorthalidone for CHD Incidence, CVD Composite Outcome, and ESRD* CHD (95% CI:0.91-1.08) CVD Composite (95% CI: 1.05-1.16) ESRD (95% CI: 0.88-1.38) Lisinopril better Chlorthalidone better 1.00 HR (Lisinopril/Chlorthalidone) In ALLHAT, 15,255 participants were randomized to chlorthalidone and 9,000+ participants were randomized to each of 3 other treatments. JAMA 2002;288:2981-2997.
Interpretation of Head to Head (Equivalence) Trials:CONVINCE and CAPPP CONVINCE equivalence bounds (0.86-1.16) CONVINCE Trial result CAPPP Trial result Overview (9 trials) 1.00 Calcium Channel Blocker better SOC better HR (Verapamil/SOC) for CONVINCE (Captopril/SOC) for CAPPP CAPPP = Captopril Primary Prevention Project. Authors concluded: “captopril and conventional treatment did not differ in efficacy.” See JAMA 2003;289: 2073-2082 for Convince Trial
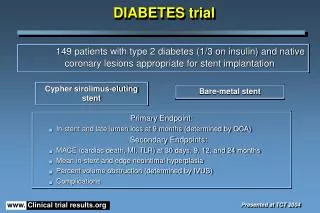
Example: 2NN Study • A study of first-line antiretroviral therapy in HIV • Main comparison between nevirapine twice daily and efavirenz (plus stavudine and lamivudine) in terms of ‘treatment failure’ (based on virology, disease progression, therapy change) • Primary objective was to establish the non-inferiority of nevirapine twice daily (δ=10%) Lancet 2004, 363:1253-63
Results: 2NN Study • Confidence intervals for failure rates (EFV-NVP) • All data (-12.8%, 0.9%) • Those starting med. (-14.6%, -0.8%) • Neither interval is completely above δ value of -10%; one interval also excludes zero.
Conclusions: 2NN Study • BUT, the authors concluded: ‘Antiviral therapy with nevirapine or efavirenz showed similar efficacy, so triple-drug regimens with either … are valid for first-line treatment’ Lancet 2004, 363:1253-63
Interpretation of Non-Inferiority Trials:6 Examples (A – F): Hazard ratio (Test Drug/Standard) and 95% CI Estimated benefit of standard drug over placebo Zone of noninferiority Test drugbetter Standarddrug better 0.6 0.7 0.8 0.9 1.0 1.1 1.2 1.3 1.4 A Superiority B C Noninferiority(i.e., Equivalence) Inferiority D E Underpowered trial F Anteman EM, Circulation 2001;103:e101-e104.
Interpretation of Non-Inferiority Trials:6 Examples (A – F) (Hazard ratio and 95% CI) Estimated benefit of standard drug over placebo Zone of noninferiority Test drugbetter Standarddrug better 0.6 0.7 0.8 0.9 1.0 1.1 1.2 1.3 1.4 A Superiority B C Noninferiority(i.e., Equivalence) Inferiority D E Underpowered trial F A = Test drug is superior to standard
Interpretation of Non-Inferiority Trials:6 Examples (A – F) (Hazard ratio and 95% CI) Estimated benefit of standard drug over placebo Zone of noninferiority Test drugbetter Standarddrug better 0.6 0.7 0.8 0.9 1.0 1.1 1.2 1.3 1.4 A Superiority B C Noninferiority(i.e., Equivalence) Inferiority D E Underpowered trial F B = Test drug is better than standard and can be considered“non-inferior” to standard
Interpretation of Non-Inferiority Trials:6 Examples (A – F) (Hazard ratio and 95% CI) Estimated benefit of standard drug over placebo Zone of noninferiority Test drugbetter Standarddrug better 0.6 0.7 0.8 0.9 1.0 1.1 1.2 1.3 1.4 A Superiority B C Noninferiority(i.e., Equivalence) Inferiority D E Underpowered trial F C = Test drug is worse than standard but not that much worse,and can be considered “non-inferior” to standard
Interpretation of Non-Inferiority Trials:6 Examples (A – F) (Hazard ratio and 95% CI) Estimated benefit of standard drug over placebo Zone of noninferiority Test drugbetter Standarddrug better 0.6 0.7 0.8 0.9 1.0 1.1 1.2 1.3 1.4 A Superiority B C Noninferiority(i.e., Equivalence) Inferiority D E Underpowered trial F D = Test drug is inferior to standard and non-inferiority criteria not satisfied.
Interpretation of Non-Inferiority Trials:6 Examples (A – F) (Hazard ratio and 95% CI) Estimated benefit of standard drug over placebo Zone of noninferiority Test drugbetter Standarddrug better 0.6 0.7 0.8 0.9 1.0 1.1 1.2 1.3 1.4 A Superiority B C Noninferiority(i.e., Equivalence) Inferiority D E Underpowered trial F E = Test drug is very inferior to standard (non-inferiority criteria not satisfied)
Interpretation of Non-Inferiority Trials:6 Examples (A – F) (Hazard ratio and 95% CI) Estimated benefit of standard drug over placebo Zone of noninferiority Test drugbetter Standarddrug better 0.6 0.7 0.8 0.9 1.0 1.1 1.2 1.3 1.4 A Superiority B C Noninferiority(i.e., Equivalence) Inferiority D E Underpowered trial F F = Trial is inconclusive due to small size and resultant wide CI
Possible Reasons forNon-Significant Difference • Small sample size • Poor compliance to study treatments • Losses-to-follow-up • Equivalent regimens Absence of proof of a treatment difference does not constitute proof of an absence of a treatment difference.
Non-Inferiority and Equivalence TrialsConsiderations • Cannot prove Pe = Pc or µ1 = µ2 therefore Ho: δ< 0 versus HA : δ> 0 is not correct because a small, underpowered study could incorrectly lead to a claim of equivalence – absence of evidence is not evidence of absence, and if power is too high, Ho may be rejected when the difference is not important. • Since Ho cannot be accepted, either reverse the roles of type 1 and 2 errors (i.e., rejection of Ho implies equivalence) or focus on confidence intervals • Treatment difference must be chosen not only to rule out smallest clinically meaningful difference, but also to be sure new treatment is better than no treatment • Consensus on what equivalence means, especially in a broad sense, is hard to achieve
1-Sided Hypothesis Testing (Non-inferiority) A = new treatment; B = standard;PA and PB = event rates (failure rate) If Ho is rejected, treatments are “equivalent” Roles of null and alternative hypotheses are reversed. In practice, this is confusing to people. Blackwelder W, Cont Clin Trials 1982
Parallel Group Studieswith Continuous Outcomes: Sample Size Formula is the Same Except for δ0 2 Note: If Δ=0, then this is equivalent to superiority trial to detect δo with 90% power.
ExampleNon-Inferiority Trial for New BP Lowering Drug 4 0 132 4 +2 525 4 -2 58 δO = 4 mmHg Δ = 0, -2 (A better) and +2 (B better) σ2 = 100; α = 0.025 (1-sided); 1-β = 0.90 1:1 allocation No. per group δO Δ
Confidence Interval ApproachExample of Type I Error A (newtreatmentbetter) B (standardtreatmentbetter)
Confidence Interval ApproachExample of Type II Error A (newtreatmentbetter) B (standardtreatmentbetter)
Prob (upper limit of CI exceeds d when d < d ) = 0 0 é ù ^ ^ Prob ( P - P ) + Z s > d = b ê ú a A B ë û 0 1 - 2 é ù ^ ^ ( P - P ) - ( P - P ) d - ( P - P ) ê ú A B A B A B Prob > - Z = b 0 ê ú a s s 1 - ê ú 2 ë û P (1 - P ) P (1 - P ) s 2 = + A A B B N N A B Sample Size for EquivalenceDesign Based on CI LimitsA = New Treatment; B = Standard
Sample Size for EquivalenceDesign Based on CI Limits (cont.)A = New Treatment; B = Standard ( ) Makuch and Simon (Cancer Treatment Reports, 1978) suggest a = 0.10 (1-sided) and b = 0.20; I like a = .05 (and usually 2-sided)
For Proportions and Relative Risks, Farrington and Manning’s Approach is Better • Problem arises because of estimation of variance under the null hypothesis. • Farrington and Manning (Stat Med 1990) have shown that their maximum likelihood approach is better particularly for small values of pc and pe. • Algorithm can be easily programmed. Stat Med 1990; 9:1447-1454
Sample Size for Proportions for Non-Inferiority Trial: Makuch and Simon versus Farrington and Manning (PA=PB)* 0.05 0.05 0.01 9,972 10,032 0.10 0.10 0.05 756 775 0.15 0.15 0.05 1,071 1,080 0.20 0.20 0.05 1,344 1,348 0.20 0.20 0.10 336 340 Sample Size per Group Makuchand Simon Farrington and Manning PA(PE) PB(PC) δO * α = 0.025 (1-sided) 1-β = 0.90 1:1 allocation
Sample Size for Proportions for Non-Inferiority Trial: Makuch and Simon versus Farrington and Manning (PA = or ≠ PB)* 0.10 0.10 0.05 756 775 0.125 0.10 0.05 3,343 3,379 0.10 0.125 0.05 371 384 Sample Size per Group Makuchand Simon Farrington and Manning PA(PE) PB(PC) δO * α = 0.025 (1-sided) 1-β = 0.90 1:1 allocation
Sample Size for Proportions: Superiority Trial with Specified Delta or Inferiority with Farrington and Manning(1:1 allocation and 1-β = 0.90) 0.05 0.05 0.01 9,021 10,032 8,174 0.10 0.10 0.05 581 775 630 0.15 0.15 0.05 917 1,080 880 0.20 0.20 0.05 1,211 1,349 1,099 0.20 0.20 0.10 266 340 277 Sample Size per Group Superiority* Farrington and Manning** PA(PE) PB(PC) δO * α = 0.05 (2-sided) PE=PC - δO ** α = 0.025 (1-sided) in 1st column; α = 0.05 (1-sided) in 2nd column
General Approach RRo RR NewTreatmentBetter StandardTreatmentBetter RRo chosen so that if upper limit < RRo, we conclude “equivalence” RRo usually ≠ 1.0
50% 67% No PI Treatment Example:CPCRA Study of Nelfinavir (NFV) and Ritonavir (RTV) for Patients with CD4+ <100 • In a placebo-controlled trial, RTV reduced the rate of progression to AIDS by 50% • The hypothesized relative risk (NFV/RTV) was chosen to correspond to a 33% loss of efficacy of RTV versus putative placebo RR (RTV/Placebo) = 0.5 Directly est. RR (NFV/RTV) = 1.33 Direct est. RR (NFV/Placebo) = 0.67 Indirectly est.
Confidence Interval Approachto Monitoring RR (NFV/RTV) 0.75 Lower limit of equiv. 1.0 No diff. 1.33 Upper limit of equiv. RTV Better NFV Better Equivalence Inconclusive