Download
1 / 40
400 likes | 677 Views
Lecture 12. Impacts of Land Use Change. Impacts of LCLUC. Pattern/Rates> Causes> Impacts > Prediction Direct and Indirect impacts Immediate and delayed impacts Temporary and permanent impacts Positive and negative impacts Biophysical and societal impacts How to quantify the impacts?.

E N D
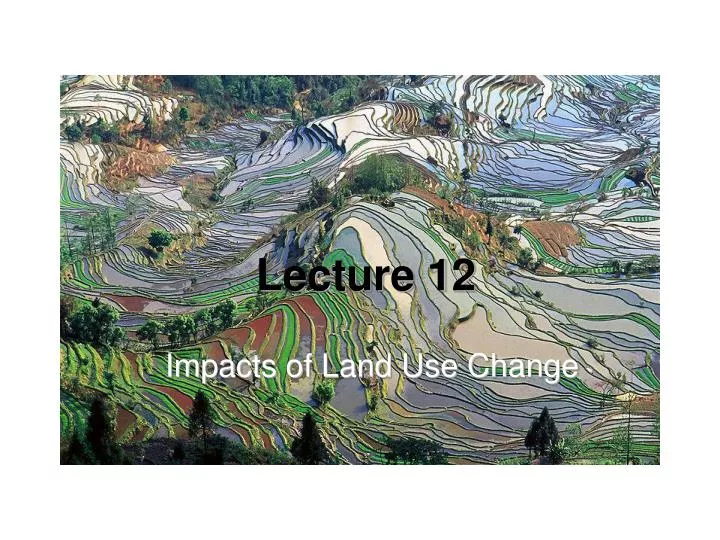
Lecture 12 Impacts of Land Use Change
Impacts of LCLUC Pattern/Rates> Causes> Impacts> Prediction • Direct and Indirect impacts • Immediate and delayed impacts • Temporary and permanent impacts • Positive and negative impacts • Biophysical and societal impacts • How to quantify the impacts?
Example Impacts • Biogeochemical Cycles • Carbon • Nitrogen • Air Quality • Smoke, • Industrial pollution • Water Cycle • Water Quality • Soil Erosion, Sedimentation • Water Availability • Land Productivity • Degradation, Salinization, Desertification, Infestations and Disease • Enhancement, Increase
Example Impacts • Biodiversity • Species loss, extinction, increase • Habitat loss or fragmentation (wetlands) • Invasive species • Societal Impacts • Human health (malaria, pollution) • Local economics and well being • Transportation - congestion, pollution • Culture, societal structure and governance • Climate Impacts • Emissions – Global • Albedo and Temperature • Water Cycle – Regional Evaporation, Precipitation
Human Health 2003 Heat Wave – more than 40,000 Europeans died. While there were contingency plans for a variety of natural and man-made catastrophes, high temperatures had never been considered a major hazard.
GHG gases Haze from fires is thick over the Indonesian island of Borneo.
Climate Regulation Precipitation is enhanced by the transpiration and evaporation over the Brazilian rain forest. Deforestation removes this vital source of water for the atmosphere.
Hydrology & Water Quality Dark patches in the Elizabeth River are signs of algae blooms, which can pose a lethal threat to other living things in the water.
Human Health Land cover change in much of the southwest U.S. has resulted in new disease vectors such as those borne by mosquitos (e.g West Nile Virus)
Biodiversity Habitat fragmentation and loss
Soil Fertility Sediment loss, nutrient run-off, salinization
Suburban encroachment on farmland alters the cultural landscape. In this scene a farmstead (center left) has been leapfrogged by a suburban development that abuts a cornfield (lower right).
California is the most important agricultural state in America and produces 42% of its fruit and 43% of its vegetables. • By 1960, already three million acres of high quality Californian farmland was lost to urban areas. • One third of the prime agricultural land was gone by 1980. • Predictions for the year 2020 show that more than fourteen million acres of the southern state's highest quality farmland will have disappeared
Effects of land use, soils, and human populations on export of water, C, N, and P from the Mid-Atlantic coastal plain Thomas R Fisher Horn Point Laboratory University of Maryland-CES NASA LCLUC Science Team meeting, 20-22 Jan 2004
Goals • Reconstruct land use history in the Choptank basin over the last 150 years using maps, aerial photos, and Landsat imagery. • Model rates of N and P export associated with the land use change.
What’s the significance of this chart? • What are the likely effects?
Environmental Impacts 1. Water Quality: Nutrient, sediment, and bacterial contamination are critical water quality problems. Pesticides and other organic contaminants are also a concern. 2. Soil Quality: Soil quality concerns center on maintenance of soil tilth by preserving and sequestering carbon in soils. 3. Air Quality: Ammonia and odorous emissions from activities connected with poultry production and the associated challenges that arise from increasingly complex urban-rural interface are air quality concerns within the watershed. 4. Loss of wetlands and wildlife habitat: Historical loss of wetlands in the Upper Choptank River sub-watershed is large compared to similar Maryland watersheds. 5. Ecosystem health of the Chesapeake Bay: Low dissolved oxygen, low water clarity, health of submerged aquatic vegetation, and populations of oysters, clams, and blue crabs dominate the list of ecosystem health concerns.
Synthesis • Land cover history controlled population growth in the basin • Agricultural conversion complete by 1800 • Limited population density for 150 years (feedback) • Service economy after 1950 increased density • Land cover change from 1665 to 2000 probably doubled losses of N and P from land to water • Small effect which would not have decreased water quality • However, land use intensity is the real driver of poor water quality (2-10x as much effect as land cover change) • Application of fertilizers to crop lands • Human population density (waste disposal)
Land Use Change Around Protected Areas and Consequences for Biodiversity P.I.: Andrew Hansen Greater Yellowstone Funding: NASA Land Cover Land Use Change Program
Land Cover/Use Change in GYE: 1975-1995 Burned +4968% Fire, logging Conifer -17% MxCon Herb;Seed/sap +90% +4% Succession, encroachment CRP Hardwood Agriculture -46% -9% Mxhw -24% Urban +348%
National Park Service Other federal lands County boundaries Home density Counties without home density data Low High Rural Homes Bozeman Billings Rexburg Idaho Falls • Population has increased 55% 1975-1995 • Rural homes increased 108% 1975-99 Jackson Pocatello Data Source County tax assessor records validated against aerial photographs
Site Total Area (km2) Total % Converted % Unprotected Lands Converted % Remaining Habitat Found Outside Reserves GYE 95,363 11 37 20 GYE: Loss of Wildland Habitats
Species Abundance/Hotspots Methods • Obtain data from field surveys of species abundances. • Develop statistical relationship with biophysical and land use predictors. • Use statistical relationship to extrapolate species abundance over the landscape. • Analyze spatial distribution of species abundance to prioritize conservation.
Predicted Bird Hotspots Bozeman Billings National Park Service Other federal lands County boundaries Biodiversity hotspots unclassified Places where bird species richness and abundance are <60% of maximum Rexburg Idaho Falls Jackson Pocatello Hotspots cover 6.4% of area
National Park Service Other federal lands County boundaries Biodiversity hotspots Biodiversity modeling mask Home density Counties without home density data Low High Bird Hotspots and Rural Homes Bozeman Billings Rexburg Idaho Falls Jackson % of hotspots on: Private land: 41% National Parks: 12.3% Pocatello • Hotspots overlap with: • Rural homes • Conifer expansion • High fire risk
Current Home Density LowHigh Avian richness > 60% of maximum Greater Yellowstone Area boundary County boundaries Yellowstone National Park Predicted Rural Homes > 1, and Avian Richness > 60% of Maximum Current Housing Density < Exurban, Predicted Housing Density > Exurban, and Avian Richness > 60% of Max. Greater Yellowstone Area boundary County boundaries Yellowstone National Park Areas predicted to have high avian richness are also the same areas receiving the most pressure from human land use: rural homes were disproportionately located close to avian hotspots. Criteria for Regional Management Within areas of high avian biodiversity, those places that are currently undeveloped but have high future development potential should be considered high priorities for future conservation efforts.
In Greater Yellowstone, low elevation population source habitats for birds have been converted to population sink areas due to rural home development. • Consequently subpopulations in Yellowstone National Park are at increased risk of extinction. • A major conclusion is that the viability of nature reserves can best be ensured by managing them in the context of the surrounding region.
Homework • Reading and discussion • Hansen et al. (2005) – Effects of exurban development on biodiversity patterns, mechanisms, and research needs, Ecological Applications
Total # of species detected Source: Hansen et al., 2005 Explain the curvilinear response