Download
1 / 22
230 likes | 863 Views
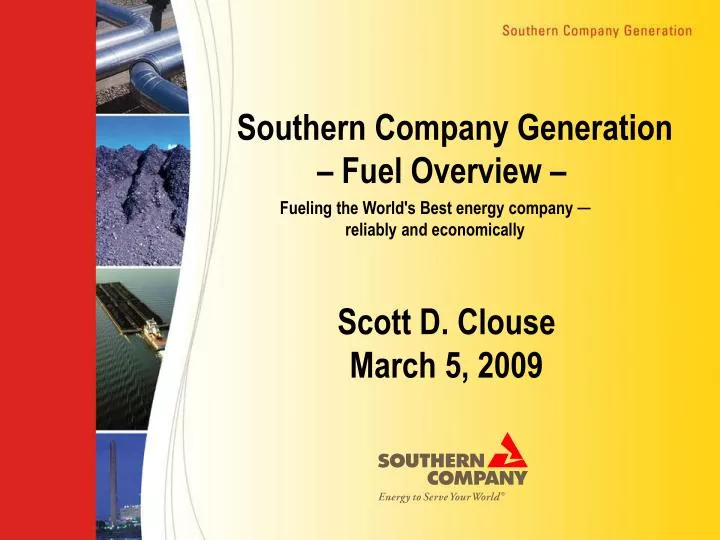
Southern Company Generation – Fuel Overview – . Fueling the World's Best energy company ─ reliably and economically. Scott D. Clouse March 5, 2009. Presentation Overview. Southern Company at a glance Strategy and Coal Procurement Process 2009 Southern Company Outlook

E N D
Southern Company Generation – Fuel Overview – Fueling the World's Best energy company ─ reliably and economically Scott D. ClouseMarch 5, 2009
Presentation Overview • Southern Company at a glance • Strategy and Coal Procurement Process • 2009 Southern Company Outlook • Future Generation Growth
Southern Company at a glance • Four Electric Utilities • Georgia Power • Alabama Power • Mississippi Power • Gulf Power • Southern Nuclear • 42,000 MW’s of generating capacity • 4.3M customers
2008 Coal Metrics: • Total Coal Cost: $5.1 B • Coal Commodity $3.3 • Transportation $1.6 • Taxes $0.1 • Lease & Maint. $0.1 • Coal Tons: 75.2 M • Coal MWs: 21,282 • Coal Plants: 21 • Coal Units: 65 • Largest coal rail fleet in U.S. – excluding the railroads (either owned or leased): ~18,000 rail cars
Diversity of Coal Purchases 2008Tons and % by Region – 100% Ownership PRB 37.8% 28.4 M Tons Western 2.6% 2.0 M Tons Illinois Basin 1.3% 1.0 M Tons CAPP 31.3% 23.6 M Tons Alabama 11.2% 8.4 M Tons Southern Company Coal Generation: 21 Coal Plants (65 units) 75.2 million tons 2008 Import – 15.7% 11.8 M tons (Colombian & Venezuelan via Ports at Mobile, Charleston and Port Kraft) * Data reported January – December 2008 Actual Receipts from FAACS
Rail Transportation (Kraft is Ocean Vessel) Barge Transportation Southern Company- Transportation Diversity Hammond Bowen Gadsden McDonough Miller Yates Gorgas Wansley Branch Gaston Scherer McIntosh Greene Cty. Kraft Mitchell Barry Crist Scholz Daniel Smith Watson
Actions taken to improve Southern’s Coal Supply Position • Increased diversification of supply sources as more Colorado, Utah, and Illinois Basin coals have been purchased for various plants • Test burns of Illinois Basin coals at some of the system’s non-scrubbed plants • Feasibility study of PRB conversions • Reviewing opportunities to blend PRB or Illinois Basin coal at various plants • Developing 3 million annual ton rail to barge loading capacity at Alabama State Docks (ASD) in Mobile, AL • Maintaining increased railcar fleet reserves to allow some non-traditional supply moves as constraints emerge • Constructed Gorgas transloader to support truck coal sourcing
Strategy and Coal Procurement Process Provide a reliable, low cost, environmentally acceptable fuel supply
Coal Procurement Strategy • Evaluate the entire value chain of fuel, transportation, operations and allowances to achieve the lowest reasonable total cost while meeting reliability and environmental requirements. • Five key risks identified and strategies to mitigate: Volume: • Flexibility needed to adjust to burn fluctuations • Procure to guideline percentages based on the generation nature of the unit Price: • Goal to be at market while mitigating significant swings • Typically 3 to 5 year contracts Supply: • Seek diversity of supply regions and transportation modes • Blending coal opportunities Reliability: • Creditworthiness • Replacement cost language Environmental: • Incorporate non-negotiable Environmental Force Majeure language in ALL contracts
Coal Procurement Process Interaction/Feedback/Inputs OPCOs/ Plants Railcar Team Treasury NPV Analysis Long Term (Mail) Admin Field Reps Logistics Strategic Plan Execute Confirmation (LOI) Short List Internet RFP Posting Initial Screening Projected Need Negotiate Terms and Conditions Spot (CIBS) Delivered cost evaluation Execute Contract(s) Paperwork (FAACS, Comtrac, P.O.’ s, etc.)
Railcar Cost L&M Freight Cost CoalCost EC GX DE GX Plant Fuel Handling Coal Pile Inventory Carrying Cost Environmental Costs (So2, NOx, etc) EC GX Total Cost Equation = Total Cost of Process (Burn)
Total Cost Example by Component Total with Sulfur= $106.65/ton or $4.44 per MMBtu Subtotal before Sulfur= $100.65/ton or $4.19 per MMBtu Note: Assumes 12,000 btu/lb coal; 1% sulfur at $300/ton of SO2 for Plant X
Evaluation of NOx • Background: • Due to requirements of the Clean Air Amendments of 1990, all OPCo’s now include NOx in the delivered cost equation • NOx predictor model (EPRI/SoCo) includes all Southern Company coal units • Process: • Enter mine specific ultimate analysis into NOx predictor model • Evaluate to applicable unit(s) • Result: • The unit specific result is reported in lbs/mmbtu • This result is converted to a $/mmbtu result by multiplying by $/ton NOx cost Example: Model result for Mine A to Plant X= 0.400 lbs/mmbtu NOx allowance cost = $2,880/ton 0.400 lbs/mmbtu x $2,880/ton = $0.576/mmbtu 2,000 lbs/ton
Total Cost Example by Component (w/ NOx) Total with Sulfur and NOx= $120.44/ton or $5.02 per MMBtu Subtotal with Sulfur= $106.65/ton or $4.44 per MMBtu Notes: Assumes 12,000 btu/lb coal; 1% sulfur at $300/ton of SO2 and $2,880/ton for NOx for Plant X and assumes Plant X has no NOx controls.
2009 Southern Company Outlook • Decrease in coal burn • Natural gas • Economy • Environmental costs • Increase in Inventory • Strategically optimize system inventories to account for any overage • Carrying cost vs. avoided cost • Projected Purchases • 2009 • 2010 - forward
Southern Company Generation Coal Program Status as of January 9,2009 Tons X 1,000 Includes Co-Owners ; January 2009 DEPS Update * Committed tons include options –this analysis includes projected burns and commitments that are in place.
Future Generation Supply Nuclear – Vogtle 3 & 4 – Georgia Power Company 2,200 MW - ownership share is 45.7% Certification ruling in March/April 2009, on-line in 2016 and 2017 Gas CC – Plant McDonough conversion – Georgia Power Company 500MW coal to 3 gas/oil CC units at 840MW each Completed in 2012 IGCC – Kemper County – Mississippi Power Company 582 MW lignite mine mouth coal gasification plant Carbon capture and sequestration capabilities Certification ruling in late 2009, on-line in November 2013 Biomass – Plant Mitchell conversion – Georgia Power Company 96 MW – one of largest biomass plants in the country Certification ruling in March/April 2009, on-line in June 2012 Lower fuel and operating costs when compared to continued operation using coal Plentiful supply all within 100 miles, low transportation costs Biomass – 5% co-firing being studied at many other system plants
Conclusion • 2009 will continue to present challenges • Environmental costs will continue to have a negative impact on coal burn • No projected additional coal purchases this year • 2010 and beyond there are projected needs • Southern Company is continuing to investigate new generation sources
Fuel Services Vision:Fueling the World's Best energy company ─ reliably and economically