Download
1 / 39
390 likes | 510 Views
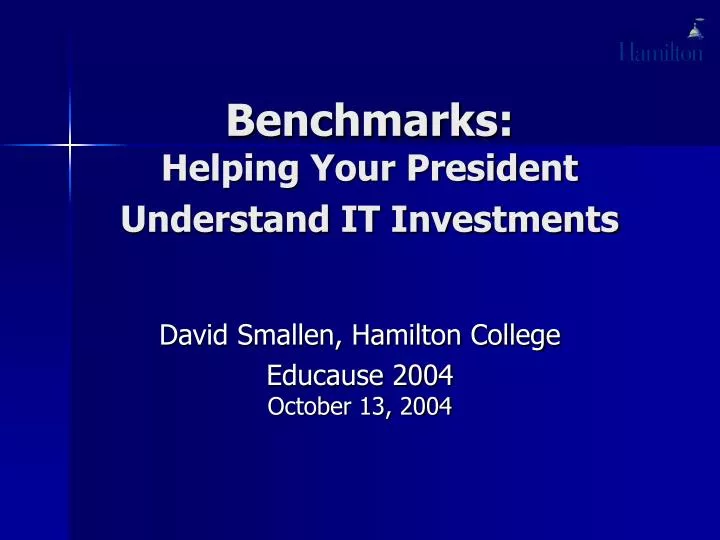
Benchmarks: Helping Your President Understand IT Investments. David Smallen, Hamilton College Educause 2004 October 13, 2004. Fundamental Assumptions. IT has become essential (IT does matter) IT has become financially significant Therefore:

E N D
Benchmarks: Helping Your President Understand IT Investments David Smallen, Hamilton College Educause 2004 October 13, 2004
Fundamental Assumptions • IT has become essential (IT does matter) • IT has become financially significant • Therefore: • IT can/ must be managed/ explained/ understood in ways similar to other traditional institutional resources • Explainable costs • Reasonable alternatives
Today’s Presentation • How much should IT cost? • High level views of budgets and staffing • Making useful comparisons • Focus today on BLA and HC Peer institutions
Data fromThe COSTS ProjectCost Of Supporting Technology Serviceswww.costsproject.org • Project began 1997 • Co-director Karen Leach • Data collected • Institutional demographics • IT budgets • IT staffing • IT Benchmarks developed
Presidents ask… • How much should IT cost? • Benchmarks • IT budget as a percent of institutional budget (Budget Impact) • IT budget per capita (Budget Support Level)
IT Benchmark Techniques • Select Peer/comparison Group • Look at the typical range • Look at multi-year trends
The Typical Range 25th percentile 75th percentile Strategic emphasis? Exceptional quality? Efficiency opportunity? Economies of scale? Effective strategies? Inadequate resources? Lower quadrant Upper quadrant
Budget Impact (IT budget as percent of institutional budget)
What drives per capita spending on IT? • Institutional or IT Service Level? • Institutional Size? • Is there evidence of economies of scale? • Complexity of IT environment? • Other?
IT Budget Per Head – BLA Institutions by Institutional Resources and Institutional Size 2500 2000 IT per Head 1500 1000 500 20000 40000 60000 80000 100000 Budget per Student Small Medium Large
Budget Impact (IT Budget/Institutional Budget) X Institutional Budget per capita (Institutional Budget/Total campus population) = Budget Support Level (IT Budget/Total campus population)
Presidents ask… • What are the key components of an IT budget? • What alternatives exist to manage that budget?
IT Staffing Benchmarks ? Service Level Aggregated Service Level Institutional Level
Aggregate Service Areas - definitions • Infrastructure support • Repair • Installation • Network • Enterprise Systems Support • ERP • Web • User Support • Help Line • Curricular • Student • Training
Service staffing as a percentage of overall IT staffing (averages)
Strategies + Programs => Staffing/Budget Levels
Strategies that could affect IT services • Infrastructure • Replacement schedule • Standards • Sourcing • Enterprise systems • Integration • Customization • User support • Service level • Sourcing • Partnerships
Programs that could affect IT services • Infrastructure • Number of technology classrooms • Enterprise systems • Self-service (Web) • User support • Number of computers • Institutional emphases
IT Services High Opportunity for change??? Strategic/ innovative?? Cost Best Practice?? ???? Low Low High Quality
Takeaways – General • Utilize ratios (benchmarks) NOT absolute numbers in comparisons • Compare with similar institutions (peers) • IT benchmarks are reflective of overall institutional resources • The “typical range” is a starting point for exploring institutional alternatives • Staffing/budget changes should reflect programmatic changes • Fine grained benchmarks may be less reliable
Takeaways – Specific • (BLA and MA institutions) IT investments have moderated in the last year after several years of outpacing institutional budgets • IT budget typically between 4 and 6 % of institutional budget • IT Budget per capita reflects available institutional resources. • (BLA and MA institutions) Approximately 50% of IT budgets are for staff • (BLA institutions) IT staff support loads are leveling out after several years of outpacing the growth in the campus population
Takeaways – Specific • (BLA institutions) Student help provides approximately 25 % of total IT support • (BLA institutions) Staffing for IT is approximately: • 25% for infrastructure, • 25% for enterprise systems • 40% for user support • Each IT staff member at MA institutions support approximately twice the number of people as IT staff at BLA institutions
Additional Resources • COSTS project: www.costsproject.org • Educause Core Data Service; www.educause.edu/apps/coredata/index.asp • CIC paper: Information Technology Benchmarks, A practical guide for College and University Presidents www.cic.org/publications/books_reports/index.asp