Download
1 / 29
290 likes | 436 Views
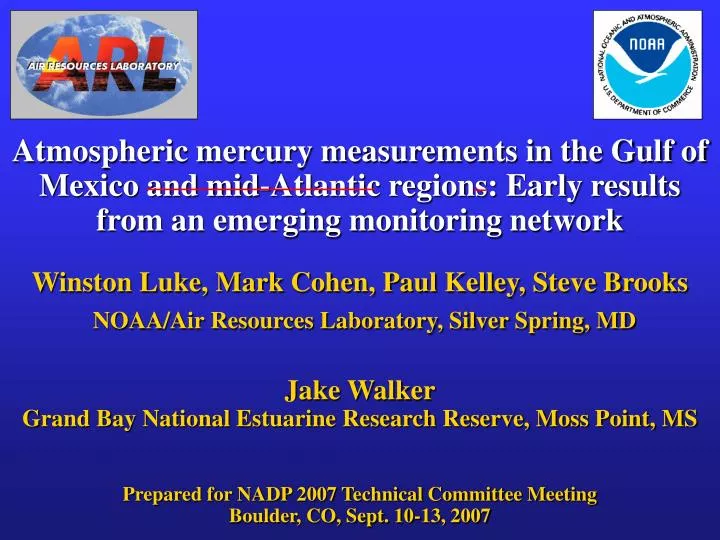
Atmospheric mercury measurements in the Gulf of Mexico and mid-Atlantic regions: Early results from an emerging monitoring network. Winston Luke, Mark Cohen, Paul Kelley, Steve Brooks NOAA/Air Resources Laboratory, Silver Spring, MD Jake Walker

E N D
Atmospheric mercury measurements in the Gulf of Mexico and mid-Atlantic regions: Early results from an emerging monitoring network Winston Luke, Mark Cohen, Paul Kelley, Steve Brooks NOAA/Air Resources Laboratory, Silver Spring, MD Jake Walker Grand Bay National Estuarine Research Reserve, Moss Point, MS Prepared for NADP 2007 Technical Committee Meeting Boulder, CO, Sept. 10-13, 2007
Canaan Valley Institute-NOAA Grand Bay NOAA NOAA Mercury Sites Beltsville EPA-NOAA Three sites committed to speciated mercury ambient concentration measurement network
Monitoring Site NOAA SEARCH USGS UWF/FSU MDN type of mercury emissions source coal-fired power plant total atmospheric mercury emissions (kg/yr, 1999 EPA NEI) waste incinerator manufacturing 1 – 50 metallurgical 50 - 100 other fuel combustion 100 - 200 200 - 400 Location of the NOAA Grand Bay NERR Atmospheric Mercury monitoring site, other atmospheric Hg monitoring sites, and major Hg point sources in the region (EPA 1999 NEI emissions inventory) Mississippi Alabama Barry MS 22 paper manuf paper manuf AL02 Pascagoula MSW incin Mobile Molino Crist Victor J. Daniel Holcim Cement Pace OLF haz waste incin Ellyson AL24 Weeks Bay Mobile Bay Jack Watson Pascagoula NOAA Grand Bay NERR Hg site
Measurements at Grand Bay NERR, MS • Tekran speciation system (Hg0, RGM, • Hg-p) installed Sept. 29, 2006 • Ancillary measurements (CO, O3, SO2) added October 20, 2006 • Sampling Height 4 m • Meteorological measurements (T, RH, WS, WD, Solar, Precip Rate/Amount) added March 1, 2007; nearby FWS station provided earlier measurements
Elemental Mercury (Hg0) As expected, with a few exceptions Hg0 concentrations show little or no diurnal variation or dependence on wind direction
Overnight Event Feb. 28-March 1 Strong correlation between Hg0 and CO, O3. Suggests combustion (natural sources?) and transport from source regions to West. RGM, Hg-P ca 20 pg m-3 during episode
Particulate Mercury (Hg-P) All Data All Data With the exception of a few well-defined transport events, Hg-P displays no consistent relationship with WD, and exhibits little or no correlation with other trace species
Strongest correlations seen between RGM and O3, most of which is driven by seasonal dependence –RGM concentrations are highest, relationship with O3 is strongest in Spring.
Fall Winter Spring Summer
Association of peak RGM with low RH and CO concentrations typical of continental influence suggests highest Spring peaks of RGM are seen in post-frontal activity, with transport from upwind continental sources to the North RGM/RH relationship is tricky, as phase partitioning may also be at issue Spring Spring
Poor correlation with SO2 suggests: A mix of primary sources with varying emission characteristics A mix of primary and secondary sources of RGM Different chemical processing and removal rates of SO2 and RGM during transport Lack of correlation –RGM and Hg-P suggests different sources and/or removal rates of these species Spring All Data
Significant diurnal patterns seen in both RGM and Hg-P, but amplitude of diurnal Hg-P profile is much smaller. Highest RGM and Hg-P concentrations seen in Spring
Similarity to O3 and SO2 diurnal profiles confirms the importance of downward mixing in the development of the daytime boundary layer, but does not allow us to differentiate between primary and secondary sources of the mercury species.
Higher RGM Associated with N-E trajectories Peak ~ 50 pg m-3 Peak ~ 118 pg m-3 Peak ~ 55 pg m-3 Peak ~ 105 pg m-3 Peak ~ 100 pg m-3 Peak ~ 65 pg m-3
Lower RGM in Maritime trajectories Peak ~ 7 pg m-3 Peak ~ 2 pg m-3 Peak ~ 10 pg m-3
Deposition Estimates RGM + Hg-P Dry Deposition (ng m-2 day-1); assumes Vd = 2.5 cm s-1 and 0.3 cm s-1 mid day average Fall Winter Spring Summer Dry Dep, Grand Bay (2006-2007) 5.4 4.3 14.2 8.6 Wet Dep, AL24 (2005-2006) 13.5 24.8 31.6 34.6 Wet Dep, MS22 (2005-2006) 11.9 28.2 28.5 65.3 Wet Dep, AL02 (2005-2006) 24.7 21.6 31.3 34.6
Summary and Conclusions • Grand Bay NERR Site typically exhibits rural/remote characteristics with generally low concentrations of all species, but with occasional transport related episodes of higher concentrations. • Elemental Hg shows little variation, little or no dependence on WD, and no discernible diurnal pattern, as expected. • Hg-P behaves similarly, but with more transport related episodes and a modest diurnal profile. • RGM exhibits a more pronounced diurnal profile. Both RGM and Hg-P profiles show increases in daytime, coincident with O3 and SO2 peaks, illustrating the importance of downward mixing of an aloft reservoir with the breakup of the nocturnal boundary layer. Photochemical (secondary) production may also be occurring.
Summary and Conclusions • RGM correlates most closely with O3 in Springtime, and is • associated with dryer air characteristic of continental • emissions (CO ca 200 ppb). • These results suggest RGM is transported from northerly continental sources following cold-frontal penetration in Spring. Reduced frequency of cold frontal passage at the site in Summer leads to lower RGM levels, more sporadic transport to the site from upwind sources. • No evidence of strong, substantial RGM production or transport in marine (Gulf) air masses. Hg in coarse aerosols? • Dry deposition estimates, when compared with nearby MDN deposition records, suggest wet deposition dominates the removal of reactive mercury species at the site, especially in Winter. If substantial Hg exists in the coarse aerosol fraction, the reported dry dep fluxes are under reported.
Recent Developments and Future Activities at Grand Bay NERR • Migration from old trailer and site to new trailer at permanent site (water’s edge, 2 miles distant) • Addition of 10m walk-up scaffold • Addition of second Tekran System • Synchronous sampling –precision, QA/QC studies, investigation of Hg/aerosol size, etc. • Asynchronous sampling for true continuous measurements • Addition of NO/NOY monitor
Pictures of Permanent Monitoring Site View from top of 10 m tower looking at the southerly (prevailing wind) sampling sector over the U.S. Fish and Wildlife Service Pavilion at Grand Bay NERR
Acknowledgments We would like to thank Gary Matlock and Russell Callender of NOAA’s National Centers for Coastal Ocean Science for their generous financial support, and to Durwin Carter (Manager, Grand Bay National Wildlife Refuge) and David Ruple (Manager, Grand Bay National Estuarine Research Reserve) for their ongoing support and assistance of this project.