Download
1 / 1
10 likes | 130 Views
Station. Date. Precipitation (in.). TSS (mg/L). TN (mg/L). TP (mg/L). FC (cfu/100ml). AllBac (copies/100ml). C1. 6/14. 0.00. 2.0. 5.89. <.025. 10. BD. 6/28. 1.59. 62.0. 3.24. .439. >600. BD. 7/12. 0.14. 5.3. 5.20. <.025. 20. 6.5 X 10 6. 7/26. 0.00. 6.7. 4.68.

E N D
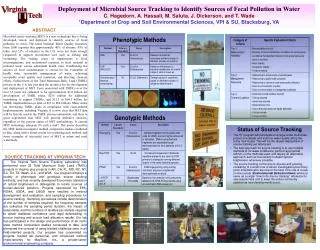
Station Date Precipitation (in.) TSS (mg/L) TN (mg/L) TP (mg/L) FC (cfu/100ml) AllBac (copies/100ml) C1 6/14 0.00 2.0 5.89 <.025 10 BD 6/28 1.59 62.0 3.24 .439 >600 BD 7/12 0.14 5.3 5.20 <.025 20 6.5 X 10⁶ 7/26 0.00 6.7 4.68 .113 80 8.0 X 10⁵ 8/9 0.44 6.7 6.04 .034 2000 6.8 X 10⁵ HR1 6/14 0.00 5.3 6.96 <.025 5 1.8 X 10⁶ 6/28 1.59 73.0 1.85 .431 >600 1.6 X 10⁶ d a c b Mike Marandola, Salem RCE, measuring flow in Cohansey. 7/12 0.14 3.0 7.22 <.025 190 3.3 X 10⁶ 7/26 0.00 8.0 7.11 .078 250 1.4 X 10⁶ 8/9 0.44 5.7 8.25 .034 2000 4.8 X 10⁶ CL-2 6/14 0.00 4.7 5.10 <.025 10 1.6 X 10⁷ 6/28 1.59 39.0 1.65 .915 >601 BD • INTRODUCTION • Bacteroidetes • A group of anaerobic, Gram positive bacteria including the genus Bacteroides. • Are good indicator organisms because they do not replicate once released into the environment. • Significantly correlate with the presence of human enteric viruses. • Normal inhabitants of the large intestines of all warm-blooded animals. - Up to 1011 cells/gram of feces - Comprise approx. 10% of fecal mass; - 1,000 to 10,000 times more numerous than coliforms • Studies have shown that there are host-specific strains in different animals. • Watershed Characteristics • Freshwater system covering 31 square miles of mixed-use land • 73% Agriculture - Includes row crop, sod farms, and field and container nurseries - Livestock, horse and chicken farms • 11% Forested Areas and 7% Wetlands • 7% Urban • Includes older homes on septic systems • All 10 stations exceed the fecal coliform water quality standard more than 10% of the time. • MST Assay • qPCR used to quantify specific sources of fecal contamination • Based on primers and probes developed by Layton et al. for the detection and quantification of: - All Bacteroidetes (AllBac) - Human-specific Bacteroidetes (HuBac) - Bovine-specific Bacteroidetes (BoBac) 7/12 0.14 10.7 6.13 .061 100 8.4 X 10⁶ 7/26 0.00 8.7 2.16 <.025 370 2.1 X 10⁶ 8/9 0.44 5.0 6.30 <.025 50 1.8 X 10⁶ Cohansey River Watershed, NJ CL-2 CL-1 C6 C5 HR1 FR1 C4 C3 % of Samples Containing Target Sequence C2 C1 C2 C3 C4 C5 C6 CL-1 CL-2 FR1 HR1 C1 Brian Hulme (RCE of Monmouth County) filtering a sample. AllBac 70 90 100 70 100 90 100 90 80 100 Figure 1 A map of the Cohansey River watershed showing land use patterns and the surface water quality monitoring locations. HuBac 40 30 20 30 10 10 10 10 0 30 BoBac 10 10 20 10 10 10 0 10 0 0 COMPARISON OF qPCR-BASED MICROBIAL SOURCE TRACKING DATA TO TRADITIONAL WATER QUALITY MEASUREMENTS IN THE UPPER COHANSEY RIVER WATERSHED *C. D. Phelps, K. A. Buckley, C. C. Obropta, and L. Y. Young Rutgers, The State University of New Jersey Rutgers, The State University of New Jersey Dept. of Environmental Sciences School of Environmental and Biological Sciences 14 College Farm Rd., Cook Campus New Brunswick, NJ 08901 (732) 932-9800 ext. 6224 phelps@envsci.rutgers.edu ABSTRACT Background: Various methods of microbial source tracking (MST) have been developed for identifying the sources of fecal contamination in the environment. We examine the usefulness of a quantitative PCR-based method targeting host-specific Bacteroides sequences for helping to develop a watershed restoration plan in an impaired watershed (Upper Cohansey River). Methods: An extensive sampling plan involving 10 stations sampled biweekly from June through November with additional events in July, August and September was carried out. Samples were analyzed for pH, DO, temperature, a full nutrient series and fecal coliforms as well as MST. The MST analysis was carried out on surface water grab samples collected in sterile bottles and held at 4˚C until processed. 100 ml of the sample was filtered onto a membrane filter and DNA was extracted from the total filtered biomass. The number of bacteroidetes from all sources (AllBac) along with human-specific (HuBac) and bovine-specific (BoBac) sources was determined by using quantitative, real-time PCR. The qPCR method is a modification of the method developed by Layton et al. (2006). The results from the qPCR analysis are compared to the results from a sanitary survey, fecal coliform monitoring, and water quality measurements. Results: The initial qPCR results show that by using bacteroidetes as a target, fecal contamination can be detected and quantified directly from surface water samples without the use of pre-culturing. The amount of contamination can be determined in terms of total fecal load and the percentage from individual sources (human, bovine and other). These values provide a higher level of discrimination than the other, traditional, measurements of water quality or the sanitary survey. Conclusions: MST based on qPCR can be used to easily identify sources of fecal contamination in watersheds. These results will enable us to expand the use of MST to better prioritize projects and therefore, produce more cost-effective and realistic solutions for microbial contamination in the watershed. • METHODS • Sampling • 10 stations were sampled from June through September of 2006. • In situ measurements of pH, DO, and Temperature made for all samples. • Surface water grab samples collected in sterile bottles. • Samples held at 4˚C until processing. • All samples analyzed for a full nutrient series, TSS, • fecal coliforms and Microbial Source Tracking • A total of 290 samples processed. • MST Assay • 100 ml of sample filtered aseptically onto a membrane filter which was cut into quarters using a sterile blade. • DNA extracted from total filtered biomass using a DNeasy® tissue kit (Qiagen). • All DNA quantified by spectroscopy and diluted in sterile water • to a concentration of 1 µg/ml • Used qPCR to measure the number of bacteroidetes present. • Total (AllBac) • Human (HuBac) • Bovine (BoBac) • TaqMan® based assay using Applied Biosystems reagents and standard conditions on an Applied Biosystems 7300 Real-Time PCR system • Copy number of each target was calculated by comparison to a standard curve made with plasmids containing human- or bovine-sourced target 16S RNA genes amplified with the primers Bac 32f and Bac 708r (Bernhard and Field, 2000). • RESULTS • Standards • Clonal libraries of 16S RNA genes generated from PCR of human and bovine feces yielded plasmids specific for HuBac and BoBac primer sets. These plasmids were quantified and used as standards for the qPCR assay. • Dilutions of plasmid DNA provided standard curves which were linear from 10 to 100,000 copies per µL. Table 2 Comparison of Bacteroidetes measurements by qPCR to other measures of water quality at 3 stations over 5 sampling dates. BD = below detection. These data show the highly variable nature of all of the water quality measures used. Figure 2 Standard Curves for quantification of Bacteroidetes: Amplification plot of all three standard curves (a), and the individual standard curves plotting log copy number vs. threshold cycle (Ct) for AllBac (b), Hubac (c), and BoBac (d) primer sets. • Quantitative Analysis • Bacteroidetes were detectable in samples from all stations at various times. • The number of “human” bacteroidetes was often as high as that of the “total” bacteroidetes and bovine bacteroidetes were rarely detected. • CONCLUSIONS • Bacteroidetes from all sources could be readily detected in 100ml surface water samples by using a qPCR assay. • Human and Bovine contributions to fecal contamination could be distinguished from each other. • Pollution sources could be determined by the frequency of detection of specific markers at particular stations over the course of the summer. • Despite the lack of obvious correlations between total Bacteroidetes and fecal coliforms, or any of the other water quality measurements, we were able to gain useful data about the sources and extent of fecal contamination in the watershed. Figure 3 Sample Data showing the numbers of bacteroidetes detected by the three primer sets on two days of sampling at all 10 stations. There was 1.59 inches of rain on 6/28 and 0.14 inches on 7/12. 6/28/2006 7/12/2006 Copy Number Station Station • Source Identification • Pollution sources could be determined by the frequency of detection of specific markers at a particular station. Table 1 Frequency of detection of AllBac, HuBac or BoBac target sequences in samples taken on 10 separate occasions. These data show that certain stations have a higher incidence of contamination with human (C-1, C-2, C-4 and HR1) or bovine (C-3) feces. References Layton, A., L. McKay, D. Williams, V. Garret, R. Gentry, and G. Sayler. 2006. Development of Bacteroides 16S rRNA Gene TaqMan-Based, Real-Time PCR Assays for Estimation of Total, Human, and Bovine Fecal Pollution. Applied Environmental Microbiology 72(6):4214-4224. Bernhard, A.E., and K.G. Field. 2000. A PCR Assay to Discriminate Human and Ruminant Feces on the Basis of Host Differences in Bacteroides – Prevotella Genes Encoding 16S rRNA. Appl. Environ. Microbiol. 66:4571-4574. Acknowledgements The authors would like to acknowledge the laboratory contributions of Brian Hulme and Ke Shi as well as undergraduate students Thomas Wang and Nicole Lordan. This project was funded in part by the New Jersey Department of Environmental Protection 319(h) Program. Project partners included the Cumberland Salem Conservation District, Rutgers Cooperative Extension of Salem County, and the Rutgers Cooperative Extension Water Resources Program (www.water.rutgers.edu).