Download
1 / 47
470 likes | 479 Views
Moreover, with the increasing trend of convenience packaging, the demand for plastic caps and closures is anticipated to increase in the coming years. Additionally, rising disposable income and trend of e-commerce shopping are further likely to positively influence the growth of the market during the forecast period. However, strict policies pertaining to the use of plastic in various economies can act as challenge for the growth of the market.

E N D
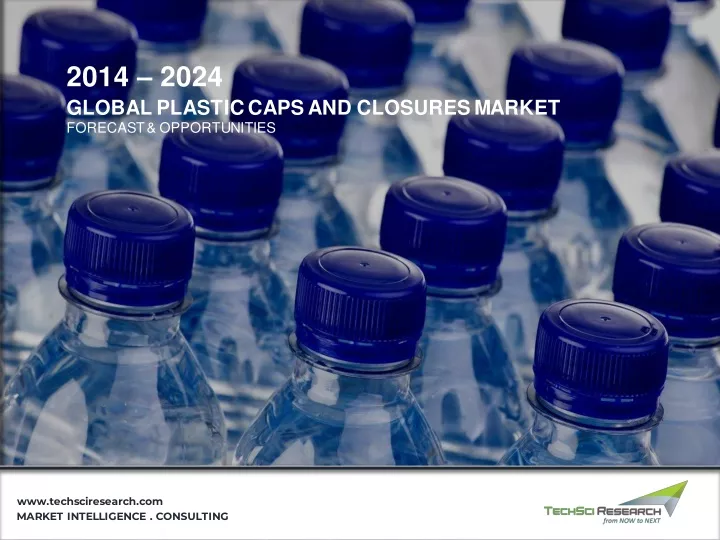
2014 – 2024 GLOBAL PLASTIC CAPS AND CLOSURES MARKET FORECAST & OPPORTUNITIES www.techsciresearch.com MARKET INTELLIGENCE . CONSULTING
Scope of Report Product of Interest (POI): Plastic Caps and Closures The primary function of caps and closures is to keep the container closed and the contents contained for the specified shelf life. In addition, it provides a barrier to dirt, moisture, and oxygen and keeps the product secure from undesired premature opening. Plastic Caps and closures are mainly used in the packaging industry to preserve products to extend their shelf life. Plastic Caps and closures industry uses different type of materials to construct suitable product packaging, such as HDPE, PP, among others. The target product can be broadly categorized among three types/segments - Screw-On Caps; Dispensing Caps; and Closures. screw-on caps are projected to form the fastest- growing type in the plastic caps and closures market as it is lightweight, cost-effective, can be tamper-evident, and can be used to package various types of products from to different industries. Market Segmentation MATERIAL END USE INDUSTRY PP ▪ Food • PRODUCT TYPE Year Range HDPE ▪ Beverages • Screw-On Caps ▪ Others ▪ Household & Personal Care • Dispensing Caps ▪ Pharmaceuticals • Review Period Aerosol Sprays o Others • 2014 – 2017 Flip Top Caps o Push-Pull Caps o TECHNOLOGY Base Year REGIONS Pumps o Injection Molding ▪ 2018 Trigger Caps North America o • Compression Molding ▪ Others o Europe • Estimated Year Asia-Pacific • 2019 South America • Middle East & Africa • Forecast Period 2020 – 2024 2
Table of Contents S. No. Contents 1. Plastic Caps and Closures: An Introduction & Product Classification 2. Research Methodology 3. Executive Summary 4. Voice of Customer/End User Analysis 4.1. Usage & Applicability Analysis 4.2. Major Influencing Factors affecting Vendor Selection 4.3. Challenges faced (Need-Gap Analysis) 5. Global Plastic Caps and Closures Market Outlook 5.1. Market Size & Forecast 5.1.1. By Value 5.2. Market Share & Forecast 5.2.1. By Product Type (Screw-On Caps; Dispensing Caps) By Dispensing Cap Type (Aerosol Sprays; Flip Top Caps; Push-Pull Caps; Pumps; Trigger Caps; and Others) 5.2.1.1. 5.2.2. By Material (PP; HDPE and Others) 5.2.3. By Technology (Injection Molding; Compression Molding) 5.2.4. By End Use Industry (Food; Beverages; Household & Personal Care; Pharmaceuticals; and Others) 5.2.5. By Region (North America; Europe; Asia Pacific; South America and Middle East & Africa) 5.2.6. By Company (2018) 5.3. Market Attractiveness Index (By Product Type; By Technology; By End Use Industry; and By Region) 6. Europe Plastic Caps and Closures Market Outlook 6.1. Market Size & Forecast 6.1.1. By Value 6.2. Market Share & Forecast 6.2.1. By Product Type By Dispensing Cap Type 6.2.1.1. 3
Table of Contents S. No. Contents 6.2.2. By Technology 6.2.3. By Material 6.2.4. By End Use Industry 6.2.5. By Country (UK; Italy; Spain; Germany; France; and Rest of Europe) 6.3. United Kingdom Plastic Caps and Closures Market Outlook 6.3.1. Market Size & Forecast 6.3.1.1. By Value 6.3.2. Market Share & Forecast 6.3.2.1. By Product Type 6.3.2.2. By End Use Industry 6.4. Germany Plastic Caps and Closures Market Outlook 6.4.1. Market Size & Forecast 6.4.1.1. By Value 6.4.2. Market Share & Forecast 6.4.2.1. By Product Type 6.4.2.2. By End Use Industry 6.5. Italy Plastic Caps and Closures Market Outlook 6.5.1. Market Size & Forecast 6.5.1.1. By Value 6.5.2. Market Share & Forecast 6.5.2.1. By Product Type 6.5.2.2. By End Use Industry 6.6. Spain Plastic Caps and Closures Market Outlook 6.6.1. Market Size & Forecast 4
Table of Contents S. No. Contents 6.6.1.1. By Value 6.6.2. Market Size & Forecast 6.6.2.1. By Product Type 6.6.2.2. By End Use Industry 6.7. France Plastic Caps and Closures Market Outlook 6.7.1. Market Size & Forecast 6.7.1.1. By Value 6.7.2. Market Share & Forecast 6.7.2.1. By Product Type 6.7.2.2. By End Use Industry 7. North America Plastic Caps and Closures Market Outlook Market Size & Forecast 7.1. 7.1.1. By Value 7.2. Market Size & Forecast 7.2.1. By Product Type By Dispensing Cap Type 7.2.1.1. 7.2.2 By Technology 7.2.3. By Material 7.2.4. By End Use Industry 7.2.5. By Country (United States; Canada; Mexico; and Rest of North America) 7.3. Canada Plastic Caps and ClosuresMarket Outlook 7.3.1. Market Size & Forecast 7.3.1.1. By Value 7.3.2. Market Size & Forecast 7.3.2.1. By Product Type 7.3.2.2. By End Use Industry 7.4. United States Plastic Caps and Closures Market Outlook 7.4.1. Market Size & Forecast 7.4.1.1. By Value 5
Table of Contents S. No. Contents 7.4.2. Market Size & Forecast 7.4.2.1. By Product Type 7.4.2.2. By End Use Industry 7.5. Mexico Plastic Caps and Closures Market Outlook 7.5.1. Market Size & Forecast 7.5.1.1. By Value 7.5.2. Market Size & Forecast 7.5.2.1. By Product Type 7.5.2.2. By End Use Industry 8. Asia Pacific Plastic Caps and Closures Market Outlook 8.1. Market Size & Forecast 8.1.1. 8.2. Market Size & Forecast By Value 8.2.1. By Product Type By Dispensing Cap Type 8.2.1.1. 8.2.2 By Technology 8.2.3. By Material 8.2.4. By End Use Industry By Country (China; Japan; India; South Korea; Singapore; Australia; and Rest of Asia Pacific) China Plastic Caps and Closures Market Outlook Market Size & Forecast 8.2.5. 8.3. 8.3.1. 8.3.1.1. Market Share & Forecast 8.3.2.1. 8.3.2.2. By Value 8.3.2. By Product Type By End Use Industry 8.4. Japan Plastic Caps and Closures Market Outlook 8.4.1. Market Size & Forecast 8.4.1.1. 8.4.2. Market Size & Forecast 8.4.2.1. 8.4.2.2. India Plastic Caps and Closures Market Outlook By Value By Product Type By End Use Industry 8.5. 6
Table of Contents S. No. Contents Market Size & Forecast 8.5.1. 8.5.1.1 Market Share & Forecast 8.5.2.1. 8.5.2.2. By Value 8.5.2. By Product Type By End Use Industry South Korea Plastic Caps and Closures Market Outlook Market Size & Forecast 8.6. 8.6.1. 8.6.1.1. Market Share & Forecast 8.6.2.1. 8.6.2.2. By Value 8.6.2. By Product Type By End Use Industry Australia Plastic Caps and Closures Market Outlook Market Size & Forecast 8.7. 8.7.1. 8.7.1.1. Market Share & Forecast 8.7.2.1. 8.7.2.2. By Value 8.7.2. By Product Type By End Use Industry Indonesia Plastic Caps and Closures Market Outlook Market Size & Forecast 8.8. 8.8.1. 8.8.1.1. Market Share & Forecast 8.8.2.1. 8.8.2.2. By Value 8.8.2. By Product Type By End Use Industry 9. South America Plastic Caps and Closures Market Outlook 9.1. Market Size & Forecast 9.1.1. 9.2. Market Share & Forecast By Value 9.2.1. By Product Type By Dispensing Cap Type 9.2.1.1. 9.2.2. By Technology 9.2.3. By Material 9.2.4. By End Use Industry 7
Table of Contents S. No. Contents By Country (Brazil; Argentina; Colombia; and Rest of South America) Brazil Plastic Caps and Closures Market Outlook 9.3.1. Market Size & Forecast 9.3.1.1. By Value 9.3.2. Market Share & Forecast 9.3.2.1. By Product Type 9.3.2.2. By End Use Industry 9.2.5. 9.3. 9.4. Argentina Plastic Caps and Closures Market Outlook 9.4.1. Market Size & Forecast 9.4.1.1. By Value 9.4.2. Market Share & Forecast 9.4.2.1. By Product Type 9.4.2.2. By End Use Industry 9.5. Colombia Plastic Caps and Closures Market Outlook 9.5.1. Market Size & Forecast 9.5.1.1. By Value 9.5.2. Market Share & Forecast 9.5.2.1. By Product Type 9.5.2.2. By End Use Industry 10. Middle East & Africa Plastic Caps and Closures Market Outlook 10.1 Market Size & Forecast 10.1.1 By Value 10.2. Market Size & Forecast 10.2.1. By Product Type By Dispensing Cap Type 10.2.1.1. 10.2.2. By Technology 10.2.3. By Material 10.2.4. By End Use Industry 10.2.5. By Country (South Africa; Saudi Arabia; UAE; Qatar; and Rest of Middle East & Africa) 10.3 UAE Plastic Caps and Closures Market Outlook 8
Table of Contents S. No. Contents Market Size & Forecast 10.3.1. 10.3.1.1. By Value 10.3.2. Market Share & Forecast 10.3.2.1. By Product Type 10.3.2.2. By End Use Industry Qatar Plastic Caps and Closures Market Outlook 10.4. Market Size & Forecast 10.4.1. 10.4.1.1. By Value 10.4.2. Market Share & Forecast 10.4.2.1. By Product Type 10.4.2.2. By End Use Industry Saudi Arabia Plastic Caps and Closures Market Outlook 10.5. Market Size & Forecast 10.5.1. 10.5.1.1. By Value 10.5.2. Market Share & Forecast 10.5.2.1. By Product Type 10.5.2.2. By End Use Industry South Africa Plastic Caps and Closures Market Outlook 10.6. Market Size & Forecast 10.6.1 10.6.1.1. By Value Market Share & Forecast 10.6.2 10.6.2.1. By Product Type 10.6.2.2. By End Use Industry 11. Market Dynamics 9
Table of Contents S. No. Contents Impact Analysis 11.1. Drivers 11.2. Increase in Demand for Bottled Water 11.2.1. Need for Convenience and Concerns About Product Safety & Security 11.2.2. 11.3. Challenges/Restraints 11.3.1. Highly Fragmented Market 12. Market Trends & Developments 13. Competitive Landscape 13.1. Competition Outlook 13.2. Company Profiles (Leading 10 Companies) 14. Strategic Recommendations 10
RESEARCH METHODOLOGY
Research Methodology Market Profiling Data Analysis Data Data Developing list of respondents Formulating Questionnaire Collection Validation In-depth secondary research was conducted to determine top players in the Global Plastic Caps & Closures market, overall market size and segmental market size. The data was scrutinized using MS-Excel, statistical tools and internal proprietary database to obtain qualitative and quantitative insights about the Global Plastic Caps & Closures Market Data obtained as a result of primary and secondary research was validated through rigorous triangulation. TechSci conducted interviews with industry experts and industry players for data collection and verification. In order to conduct industry experts’ interviews, TechSci formulated a detailed discussion guide. List of industry players and industry specialists was developed. Primary Research Desk Research Company Analysis ✓ Recent Developments ✓ Market Changing Aspects/Dynamics ✓ Government Policies ✓ Final Conclusion ✓ Market Participants ✓ Key Strengths ✓ Identifying Key Opinion Leaders ✓ Questionnaire Design ✓ In-depth Interviews Actionable Insights Data Filter & Analysis Business Solution Research & Intelligence Data Collection Primary Research Secondary Research Paid Sources LinkedIn TechSci Internal Database Company Websites Company A nnual Reports White Paper Study Financial Reports Investor Presentations Regulatory Body A ssociations, etc. Factiva Hoovers ✓ ✓ ✓ ✓ ✓ ✓ ✓ ✓ ✓ ✓ ✓ 12
Research Methodology Baseline Methodology Our dedicated team of industry experts has monitored and analyzed various aspects of Global Plastic Caps & Closures market. The team has analyzed the outlook of various segments of this market, while considering the major influencing factors such as convenience demanded by consumers and concerns about product safety and security; decreasing pack sizes; rising demand from end-use industries; growing demand from emerging economies; etc. and speculated a positive growth during the next 5 years. The study includes market forecasting which would enable our clients to take better decisions while planning their strategy to achieve sustainability in Global Plastic Caps & Closures market. Methodology Followed for Calculation of Market Size: Market Size by Value: Market size, in terms of value, for the year 2018 was calculated based on information collected through exhaustive • secondary research and primary surveys, with various key opinion leaders/stakeholders, such as Plastic Caps & Closures supplier companies, channel partners, end users, industry experts, and other industry participants. The team interviewed more than 20 – 25 Plastic Caps & Closures supplier companies, 80 – 100 channel partners, 80 – 100 end users, and 15 • – 20 Industry experts and other value chain stakeholders in Global Plastic Caps & Closures market to obtain the overall market size from 2014-2018, which was validated by the Delphi technique. Taking standard deviation into consideration, the market size was averaged out, to arrive at the market size data from 2014-2018. 13
Research Methodology Respondents were asked about the current and future market growth rates, market shares by type of plastic caps & closures, by each • region. Removing the outlier responses, the geometric mean of growth estimates and supplier wise revenue shares generated across various segments were considered, to arrive at the final revenue shares. Revenue shares generated across various segments were further triangulated from other stakeholders depending upon the type of Plastic Caps & Closures. Methodology Followed for Calculation of Market Shares: Market shares by product type, by material, by technology, by end use industry, by region and by company were calculated based on the responses received through primary surveys with industry experts, in which the respondents were asked about the market shares or revenue generated from various type of plastic caps & closures. The final shares were calculated by taking the geometric mean of the responses gathered from key opinion leaders after eliminating the outliers. Methodology Followed for Forecasting: TechSci Research performed periodical checks on data collected through the surveys with logic checks and analyzed the survey results in • SPSS/Tableau Software. Data triangulation techniques were applied to fill the gaps and to present a more meaningful picture of the market. To forecast Global • Plastic Caps & Closures market, TechSci Research used various forecast techniques such as: Moving Average ✓ Time Series Analysis ✓ Regression Analysis ✓ Econometric and Judgmental Analysis ✓ 14
Research Methodology TechSci Research used its own forecast tool, which is based on the growth of various allied industries in respective regions. TechSci Research also used the impact analysis during short, medium and long term period to estimate the demand and to reach accurate market numbers. It should be noted that the figures compiled are only for the organized market including market share data. Partial List of Companies Interviewed Key Secondary Sources RPC Group PLC Reynolds Group Holdings Limited Crown Holdings Inc. Rexam PLC Berry Plastics Corporation Silgan Holdings Inc. Aptargroup Inc. Guala Closures Group Bericap GmbH Co. & Kg Amcor Limited Oriental Containers Global Closure Systems Closure Systems International Capsugel Inc. Agropur Cooperative Closure and Container Manufacturers Association (CCMA) European Association for Aerosols Consumer Aerosol Products Council (CAPCO) Association of Visual Packaging Manufacturers Closure Manufacturers Association Institute of Packaging Professionals National Association of Container Distributors National Beverage Packaging Association Flexible Packaging Association (FPA) Retail Packaging Association (RPA) International Monetary Fund (IMF) World Bank TechSci Research Proprietary Database & Knowledge Repository Company Annual Reports Industry Magazines Industry Reports News Dailies Credible Paid Databases ▪ ▪ ▪ ▪ ▪ ▪ ▪ ▪ ▪ ▪ ▪ ▪ ▪ ▪ ▪ ▪ ▪ ▪ ▪ ▪ ▪ ▪ ▪ ▪ ▪ ▪ ▪ ▪ ▪ ▪ ▪ ▪ ▪ 15
Research Methodology Currency Exchange Rates The currency used in the report is the United States Dollar (USD), with the market size indicated in USD million. • The company revenues were taken from their annual reports. • Average annual currency conversion rate was used for companies that reported their revenue in other currencies. • Country 2014 2015 2016 2017 2018 United States (USD) 1 1 1 1 1 Canada (Canadian Dollar) 1.10 1.28 1.33 1.30 1.30 Mexico (Mexican Peso) 13.31 15.79 18.68 18.91 19.23 Germany (Euro) 0.75 0.90 0.90 0.89 0.85 United Kingdom (Pound) 0.61 0.65 0.74 0.78 0.75 India (INR) 61.01 64.12 67.18 65.11 68.41 China (Yuan) 6.16 6.28 6.64 6.76 6.62 Japan (Yen) 105.86 121.06 108.80 112.15 110.43 South Korea (Won) 1,053.58 1,132.33 1,161.22 1,130.44 1,100.50 Singapore (Singapore Dollar) 1.27 1.37 1.38 1.38 1.35 Australia (Australian Dollar) 1.11 1.33 1.35 1.30 1.34 Brazil (Real) 2.35 3.34 3.49 3.19 3.65 Argentina (Peso) 8.11 9.25 14.76 16.56 28.14 Colombia (Colombian Peso) 2,000.65 2,740.97 3,053.16 2,948.89 2,956.12 South Africa (Rand) 10.84 12.77 14.71 13.30 13.26 Saudi Arabia (Riyal) 3.75 3.75 3.75 3.75 3.75 UAE (Dirham) 3.67 3.67 3.67 3.67 3.67 Qatar (Qatari Riyal) 3.64 3.64 3.64 3.67 3.64 Source: US Forex, The Bureau of the Fiscal Service and US Department of Treasury 16
GLOBAL PLASTIC CAPS & CLOSURES MARKET EXECUTIVE SUMMARY
Executive Summary 1. Global Plastic Caps & Closures Market to Grow at a CAGR of XX% during 2019E-2024F Global Plastic Caps & Closures Market Size, By Value, 2019E & 2024F (USD Million) $XX Million 2024F XX% CAGR Market Growth Drivers $XX Million 2019E XXX YYY XXX region to Dominate Global Plastic Caps & Closures Market through 2024F 2. Regional Growth Drivers: XYZ Region Rest of World XXX Region dominated the market in 2018 and is anticipated to XXXXXXXX during the next five years. XX% XX% 2018 2018 XX% XX% YYY Region dominated the market in 2018 and is anticipated to XXXXXXXX during the next five years. 2024F 2024F Source: Secondary Research, Expert Interviews, and TechSci Research Analysis Note: These are dummy figures; please purchase our report for actual data 18
Executive Summary Company A Dominates Global Plastic Caps & Closures Market 3. Global Plastic Caps & Closures Market, By Share, By Company, By Value, 2018 20% Company A Market Leader’s Best Practices Company B 50% 2018 25% Company C XXX YYY Company D 10% Others 5% 4. Product Type A holds the Largest Share in Global Plastic Caps & Closures Market Global Plastic Caps & Closures Market Share, By Product Type, By Value, 2018 Product Type A’s Growth Drivers: Screw-On Caps 2018 50.00% 50.00% XXX YYY Dispensing Caps Source: Secondary Research, Expert Interviews, and TechSci Research Analysis Note: These are dummy figures; please purchase our report for actual data 19
GLOBAL PLASTIC CAPS & CLOSURES MARKET OUTLOOK
Global Plastic Caps & Closures Market Size, By Value Figure XX: Global Plastic Caps & Closures Market Size, By Value, 2014–2024F (USD Million) 15.00 14.00 13.00 12.00 11.00 10.00 9.00 8.00 7.00 6.00 5.00 2014 2018 2019E 2024F CAGR BY VALUE CAGR BY VALUE XX% XX% Figure XX: Global Personal Care Market Size, 2018 & 2024F (USD Billion) Global Plastic Caps & Closures market is anticipated to grow at YY% during the forecast period owing to the factors: XXX 2024F ▪ XXX ▪ XXX ▪ XXX XXX 2018 Source: Secondary Research, Expert Interviews, and TechSci Research Analysis Note: These are dummy figures; please purchase our report for actual data 21
Global Plastic Caps & Closures Market Share, By Product Type Figure XX: Global Plastic Caps & Closures Market Share, By Product Type, By Value, 2014–2024F Screw-On Caps Dispensing Caps 2024F 50% 50% 2023F 50% 50% 2022F 50% 50% 2021F 50% 50% 2020F 50% 50% 2019E 50% 50% 2018 50% 50% 2017 50% 50% 2016 50% 50% 2015 50% 50% 2014 50% 50% XXX Product Type dominated the market in 2018. However, YYY is anticipated to gain maximum traction during the forecast period on the back of: XXX XXX XXX ▪ ▪ ▪ Source: Secondary Research, Expert Interviews, and TechSci Research Analysis Note: These are dummy figures; please purchase our report for actual data 22
Global Plastic Dispensing Caps & Closures Market Share, By Type Figure XX: Global Plastic Dispensing Caps & Closures Market Share, By Type, By Value, 2014–2024F 10% 12% 13% 15% 16% 18% 19% 21% Others 22% 24% 25% 30% 29% 27% Trigger Caps 26% 24% 23% 21% 20% 18% 17% 15% Pumps 15% 16% 17% 18% 19% 20% 21% 22% 23% 24% 25% Push-Pull Caps 15% 14% 13% 12% 11% 10% 9% 8% 7% 6% 5% Flip Top Caps 15% 16% 17% 18% 19% 20% 21% 22% 23% 24% 25% Aerosol Sprays 15% 14% 13% 12% 11% 10% 9% 8% 7% 6% 5% 2014 2015 2016 2017 2018 2019E 2020F 2021F 2022F 2023F 2024F Figure XX: Global Non-Alcoholic Beverages Market Growth Rate, By Value, 2014-2018 (%) XXX type dominated the market in 2018. However, YYY is anticipated to gain maximum traction during the forecast period on the back of: 25% 20% 25% 20% 15% XXX XXX XXX ▪ 10% 15% ▪ 5% 10% ▪ 5% 0% 2 0 1 4 2 0 1 5 2 0 1 6 2 0 1 7 2 0 1 8 Source: Secondary Research, Expert Interviews, and TechSci Research Analysis Note: These are dummy figures; please purchase our report for actual data 23
Global Plastic Caps & Closures Market Share, By Material Figure XX: Global Plastic Caps & Closures Market Share, By Material, By Value, 2014–2024F 20% 21% 22% 23% 24% 25% 26% 27% 28% 29% 31% Others 29% 29% 28% 28% 27% 27% 26% 26% 25% 25% 24% HDPE 51% 51% 50% 50% 49% 49% 48% 48% 47% 47% 45% PP 2014 2015 2016 2017 2018 2019E 2020F 2021F 2022F 2023F 2024F Figure XX: Global Blow Molding Resin Market Size, By Value, 2014-2018 (USD Million) XXX material dominated the market in 2018. However, YYY is anticipated to gain maximum traction during the forecast period on the back of: 25.00 20.00 25.00 20.00 15.00 XXX XXX XXX ▪ 10.00 15.00 ▪ 5.00 10.00 ▪ 5.00 0.00 2 0 1 4 2 0 1 5 2 0 1 6 2 0 1 7 2 0 1 8 Source: Secondary Research, Expert Interviews, and TechSci Research Analysis Note: These are dummy figures; please purchase our report for actual data 24
Global Plastic Caps & Closures Market Share, By Technology Figure XX: Global Plastic Caps & Closures Market Share, By Technology, By Value, 2014–2024F Compression Molding 33% 34% 35% 36% 37% 38% 39% 40% 41% 42% 43% Injection Molding 33% 32% 30% 29% 27% 26% 24% 23% 21% 20% 18% 2014 2015 2016 2017 2018 2019E 2020F 2021F 2022F 2023F 2024F Global Plastic Caps & Closures market is anticipated to grow at YY% during the forecast period owing to the factors: ▪ XXX ▪ XXX ▪ XXX Source: Secondary Research, Expert Interviews, and TechSci Research Analysis Note: These are dummy figures; please purchase our report for actual data 25
Global Plastic Caps & Closures Market Share, By End Use Industry Figure XX: Global Plastic Caps & Closures Market Share, By End Use Industry, By Value, 2014–2024F Others 20.00% 20.50% 21.00% 21.50% 22.00% 22.50% 23.00% 23.50% 24.00% 24.50% 25.00% Pharmaceuticals 20.00% 21.00% 22.00% 23.00% 24.00% 25.00% 26.00% 27.00% 28.00% 29.00% 30.00% Household & Personal Care 20.00% 18.50% 17.00% 15.50% 14.00% 12.50% 11.00% 9.50% 8.00% 6.50% 5.00% Beverages 20% 21% 22% 23% 24% 25% 26% 27% 28% 29% 30% Food 20% 19% 18% 17% 16% 15% 14% 13% 12% 11% 10% 2014 2015 2016 2017 2018 2019E 2020F 2021F 2022F 2023F 2024F Global Plastic Caps & Closures market is anticipated to grow at YY% during the forecast period owing to the factors: ▪ XXX ▪ XXX ▪ XXX Source: Secondary Research, Expert Interviews, and TechSci Research Analysis Note: These are dummy figures; please purchase our report for actual data 26
Global Plastic Caps & Closures Market Share, By Region Figure XX: Global Plastic Caps & Closures Market Share, By Region, By Value, 2018 & 2024F North America 20% 2024F 20% 2018 South America 20% 2024F 20% 2018 Middle East & Africa Europe Asia-Pacific 20% 20% 2024F 20% 2024F 2024F 20% 20% 2018 2018 20% 2018 Source: Secondary Research, Expert Interviews, and TechSci Research Analysis Note: These are dummy figures; please purchase our report for actual data 27
Global Plastic Caps & Closures Market Share, By Company Figure XX: Global Plastic Caps & Closures Market Share, By Company, By Value, 2018 25% 100% 7% 20% 17% 12% 8% 7% 4% Total Company 1 Company 2 Company 3 Company 4 Company 5 Company 6 Company 7 Others Top 5 companies alone control XXX% in Plastic Caps & Closures market with XX+ players having a total market share of XXX% Source: Secondary Research, Expert Interviews, and TechSci Research Analysis Note: These are dummy figures; please purchase our report for actual data 28
Global Plastic Caps & Closures Country Mapping Figure XX: Country Map on the basis of Market Size (USD Billion) & Growth Rate (%) 16.00% Market Size @ USD XXX Mn (High Growth-Low Growing Market Market Size) India (High Growth-High Ideal Market Market Size) 12.00% China CAGR (2019E-2024F) Qatar 8.00% Overall Market Growth @ XX% UAE Colombia Brazil Mexico Romania Argentina Australia Russia (Low Growth-High 4.00% Market Size) Netherlands Big Market Canada (Low Growth-Low Poland Common Market Market Size) United Kingdom Germany united states Japan France South Africa Austria Saudi Arabia Italy 0.00% 0.00 4,000.00 8,000.00 12,000.00 16,000.00 20,000.00 Market Size (USD Million) Source: Secondary Research, Expert Interviews, and TechSci Research Analysis Note: These are dummy figures; please purchase our report for actual data 29
Global Plastic Caps & Closures End Use Industry Mapping Figure XX: End Use Industry Map on the basis of Market Size (USD Billion) & Growth Rate (%) 16.00% Market Size @ USD XXX Mn (High Growth-Low Growing Market Market Size) (High Growth-High Ideal Market Market Size) 12.00% CAGR (2019E-2024F) Others 8.00% Beverages Overall Market Growth @ XX% Household & Personal Care Food Pharmaceuticals (Low Growth-High 4.00% Market Size) Big Market (Low Growth-Low Common Market Market Size) 0.00% 0.00 4,000.00 8,000.00 12,000.00 16,000.00 20,000.00 Market Size (USD Billion) Source: Secondary Research, Expert Interviews, and TechSci Research Analysis Note: These are dummy figures; please purchase our report for actual data 30
EUROPE PLASTIC CAPS & CLOSURES MARKET OUTLOOK
Europe Plastic Caps & Closures Market Size, By Value Figure XX: Europe Plastic Caps & Closures Market Size, By Value, 2014–2024F (USD Million) 15.00 14.00 13.00 12.00 11.00 10.00 9.00 8.00 7.00 6.00 5.00 2014 2018 2019E 2024F CAGR BY VALUE CAGR BY VALUE XX% XX% Figure XX: Europe Carbonized Soft Drink Market Size, 2018 & 2024F (USD Billion) Europe Plastic Caps & Closures market is anticipated to grow at YY% during the forecast period owing to the factors: XXX 2024F ▪ XXX ▪ XXX ▪ XXX XXX 2018 Source: Secondary Research, Expert Interviews, and TechSci Research Analysis Note: These are dummy figures; please purchase our report for actual data Note: In this report, similar analysis and data representation has been followed for all the other Regions. 32
Europe Plastic Caps & Closures Market Share, By Product Type Figure XX: Europe Plastic Caps & Closures Market Share, By Product Type, By Value, 2014–2024F Screw-On Caps Dispensing Caps 2024F 50% 50% 2023F 50% 50% 2022F 50% 50% 2021F 50% 50% 2020F 50% 50% 2019E 50% 50% 2018 50% 50% 2017 50% 50% 2016 50% 50% 2015 50% 50% 2014 50% 50% XXX Product Type dominated the market in 2018. However, YYY is anticipated to gain maximum traction during the forecast period on the back of: XXX XXX XXX ▪ ▪ ▪ Source: Secondary Research, Expert Interviews, and TechSci Research Analysis Note: These are dummy figures; please purchase our report for actual data Note: In this report, similar analysis and data representation has been followed for all the other Regions. 33
Europe Plastic Dispensing Caps & Closures Market Share, By Type Figure XX: Europe Plastic Dispensing Caps & Closures Market Share, By Type, By Value, 2014–2024F 10% 12% 13% 15% 16% 18% 19% 21% Others 22% 24% 25% 30% 29% 27% Trigger Caps 26% 24% 23% 21% 20% 18% 17% 15% Pumps 15% 16% 17% 18% 19% 20% 21% 22% 23% 24% 25% Push-Pull Caps 15% 14% 13% 12% 11% 10% 9% 8% 7% 6% 5% Flip Top Caps 15% 16% 17% 18% 19% 20% 21% 22% 23% 24% 25% Aerosol Sprays 15% 14% 13% 12% 11% 10% 9% 8% 7% 6% 5% 2014 2015 2016 2017 2018 2019E 2020F 2021F 2022F 2023F 2024F Figure XX: Europe Food & Beverages Market Growth Rate, By Value, 2014-2018 (%) XXX type dominated the market in 2018. However, YYY is anticipated to gain maximum traction during the forecast period on the back of: 25% 20% 25% 20% 15% XXX XXX XXX ▪ 10% 15% ▪ 5% 10% ▪ 5% 0% 2 0 1 4 2 0 1 5 2 0 1 6 2 0 1 7 2 0 1 8 Source: Secondary Research, Expert Interviews, and TechSci Research Analysis Note: These are dummy figures; please purchase our report for actual data Note: In this report, similar analysis and data representation has been followed for all the other Regions. 34
Europe Plastic Caps & Closures Market Share, By Material Figure XX: Europe Plastic Caps & Closures Market Share, By Material, By Value, 2014–2024F 20% 21% 22% 23% 24% 25% 26% 27% 28% 29% 31% Others 29% 29% 28% 28% 27% 27% 26% 26% 25% 25% 24% HDPE 51% 51% 50% 50% 49% 49% 48% 48% 47% 47% 45% PP 2014 2015 2016 2017 2018 2019E 2020F 2021F 2022F 2023F 2024F Figure XX: Europe Plastic Packaging Industry Market Size, By Value, 2014-2018 (USD Million) XXX material dominated the market in 2018. However, YYY is anticipated to gain maximum traction during the forecast period on the back of: 25.00 20.00 25.00 20.00 15.00 XXX XXX XXX ▪ 10.00 15.00 ▪ 5.00 10.00 ▪ 5.00 0.00 2 0 1 4 2 0 1 5 2 0 1 6 2 0 1 7 2 0 1 8 Source: Secondary Research, Expert Interviews, and TechSci Research Analysis Note: These are dummy figures; please purchase our report for actual data Note: In this report, similar analysis and data representation has been followed for all the other Regions. 35
Europe Plastic Caps & Closures Market Share, By Technology Figure XX: Europe Plastic Caps & Closures Market Share, By Technology, By Value, 2014–2024F Compression Molding 33% 34% 35% 36% 37% 38% 39% 40% 41% 42% 43% Injection Molding 33% 32% 30% 29% 27% 26% 24% 23% 21% 20% 18% 2014 2015 2016 2017 2018 2019E 2020F 2021F 2022F 2023F 2024F Europe Plastic Caps & Closures market is anticipated to grow at YY% during the forecast period owing to the factors: ▪ XXX ▪ XXX ▪ XXX Source: Secondary Research, Expert Interviews, and TechSci Research Analysis Note: These are dummy figures; please purchase our report for actual data Note: In this report, similar analysis and data representation has been followed for all the other Regions. 36
Europe Plastic Caps & Closures Market Share, By End Use Industry Figure XX: Europe Plastic Caps & Closures Market Share, By End Use Industry, By Value, 2014–2024F Others 20.00% 20.50% 21.00% 21.50% 22.00% 22.50% 23.00% 23.50% 24.00% 24.50% 25.00% Pharmaceuticals 20.00% 21.00% 22.00% 23.00% 24.00% 25.00% 26.00% 27.00% 28.00% 29.00% 30.00% Household & Personal Care 20.00% 18.50% 17.00% 15.50% 14.00% 12.50% 11.00% 9.50% 8.00% 6.50% 5.00% Beverages 20% 21% 22% 23% 24% 25% 26% 27% 28% 29% 30% Food 20% 19% 18% 17% 16% 15% 14% 13% 12% 11% 10% 2014 2015 2016 2017 2018 2019E 2020F 2021F 2022F 2023F 2024F Europe Plastic Caps & Closures market is anticipated to grow at YY% during the forecast period owing to the factors: ▪ XXX ▪ XXX ▪ XXX Source: Secondary Research, Expert Interviews, and TechSci Research Analysis Note: These are dummy figures; please purchase our report for actual data Note: In this report, similar analysis and data representation has been followed for all the other Regions. 37
Europe Plastic Caps & Closures Market Share, By Country Figure XX: Europe Plastic Caps & Closures Market Share, By Country, By Value, 2018 & 2024F Rest of Europe 2024F 20% 2018 20% United Kingdom 2024F 20% 2018 20% France 2024F 20% 2018 20% Italy Germany Spain 2024F 20% 2024F 20% 2024F 20% 2018 20% 2018 20% 2018 20% Note: In this report, similar analysis and data representation has been followed for all the other Regions. 38
Germany Plastic Caps & Closures Market Size, By Value Figure XX: Germany Plastic Caps & Closures Market Size, By Value, 2014–2024F (USD Million) 15.00 14.00 13.00 12.00 11.00 10.00 9.00 8.00 7.00 6.00 5.00 2014 2018 2019E 2024F CAGR BY VALUE CAGR BY VALUE XX% XX% Figure XX: Germany Personal Care Market Size, 2018 & 2024F (USD Billion) Germany Plastic Caps & Closures market is anticipated to grow at YY% during the forecast period owing to the factors: XXX 2024F ▪ XXX ▪ XXX ▪ XXX XXX 2018 Source: Secondary Research, Expert Interviews, and TechSci Research Analysis Note: These are dummy figures; please purchase our report for actual data Note: In this report, similar analysis and data representation has been followed for all the other Countries. 39
Germany Plastic Caps & Closures Market Share, By Product Type Figure XX: Germany Plastic Caps & Closures Market Share, By Product Type, By Value, 2014–2024F Screw-On Caps Dispensing Caps 2024F 50% 50% 2023F 50% 50% 2022F 50% 50% 2021F 50% 50% 2020F 50% 50% 2019E 50% 50% 2018 50% 50% 2017 50% 50% 2016 50% 50% 2015 50% 50% 2014 50% 50% XXX Product Type dominated the market in 2018. However, YYY is anticipated to gain maximum traction during the forecast period on the back of: XXX XXX XXX ▪ ▪ ▪ Source: Secondary Research, Expert Interviews, and TechSci Research Analysis Note: These are dummy figures; please purchase our report for actual data Note: In this report, similar analysis and data representation has been followed for all the other Countries. 40
Germany Plastic Caps & Closures Market Share, By End Use Industry Figure XX: Germany Plastic Caps & Closures Market Share, By End Use Industry, By Value, 2014–2024F Others 20.00% 20.50% 21.00% 21.50% 22.00% 22.50% 23.00% 23.50% 24.00% 24.50% 25.00% Pharmaceuticals 20.00% 21.00% 22.00% 23.00% 24.00% 25.00% 26.00% 27.00% 28.00% 29.00% 30.00% Household & Personal Care 20.00% 18.50% 17.00% 15.50% 14.00% 12.50% 11.00% 9.50% 8.00% 6.50% 5.00% Beverages 20% 21% 22% 23% 24% 25% 26% 27% 28% 29% 30% Food 20% 19% 18% 17% 16% 15% 14% 13% 12% 11% 10% 2014 2015 2016 2017 2018 2019E 2020F 2021F 2022F 2023F 2024F Germany Plastic Caps & Closures market is anticipated to grow at YY% during the forecast period owing to the factors: ▪ XXX ▪ XXX ▪ XXX Source: Secondary Research, Expert Interviews, and TechSci Research Analysis Note: These are dummy figures; please purchase our report for actual data Note: In this report, similar analysis and data representation has been followed for all the other Countries. 41
COMPETITIVE INTELLIGENCE
Product Benchmarking Matrix Value Proposition Of Leading Companies In Plastic Caps & Closures Market Key Features / Companies Company 1 Company 2 Company 3 Company 4 Company 5 Screw-On Caps/ Dispensing Caps Screw-On Caps/ Dispensing Caps Screw-On Caps/ Dispensing Caps Screw-On Caps/ Dispensing Caps Screw-On Caps/ Dispensing Caps Key Product Types Flip Flip Key Dispensing Cap Types Aerosol Caps Flop/Push- Pull Aerosol Caps Flop/Push- Pull Aerosol Caps Key Materials Used XXX XXX XXX XXX XXX Food and Beverages Household & Personal Care Key End Use Industry Served XXX XXX XXX Key Feature 5 XXX XXX XXX XXX XXX Key Feature 6 XXX XXX XXX XXX XXX Key Feature N… XXX XXX XXX XXX XXX Source: Secondary Research, Expert Interviews, and TechSci Research Analysis Note: These are dummy figures; please purchase our report for actual data 43
Competitor Profile RPC Group Plc COMPANY DESCRIPTION PRODUCT PORTFOLIO Product Portfolio: Business Overview: XXXX • RPC Group Plc operates as a plastic product design and • XXXX • XXXX engineering company worldwide. It operates through two • segments, Packaging and Non-Packaging. The Packaging Product Availability (w.r.t. Product of Interest): segment designs plastic packaging for end markets, including XXXX • XXXX the food, beverage, personal care, and healthcare markets; and • XXXX • designs and manufactures other plastic products, such as Key Industries Served (w.r.t. Product of Interest): containers for surface coatings comprising paint pots and vaping XXXX • accessories. It sells its products directly to the brands, as well as XXXX • XXXX to retailers or fillers. The company was founded in 1991 and is • headquartered in Rushden, the United Kingdom. Key Competitors: XXXX • XXXX • XXXX XXXX • • XXXX • Year of Establishment: 1991 XXXX • Total Number of Employees (2018): XXXX 44
Competitor Profile RPC Group Plc RECENT DEVELOPMENTS GROWTH STRATEGIES February, 2019: RPC Tedeco-Gizeh, the UK’s sole ▪ XXXX ▪ manufacturer of plastic vending cups, is launching a unique initiative to help customers recycle their used cups into XXXX ▪ valuable second life products. The company is working with its sister business from the RPC Group, RPC bpi recycled XXXX ▪ products, so that vending suppliers and operators who collect their own used cups can deliver them to the RPC bpi facility --Expansion Plans ▪ in Dumfries. There they will be reprocessed and blended with --Partnerships ▪ other recycled polymers for use in the manufacture of RPC bpi’s market-leading Plaswood. This is a high-performance lumber made from 100% recycled plastic that does not rot, splinter, crack or degrade with age and requires no maintenance. Products manufactured in Plaswood include fences, posts and outdoor furniture. XXXX ▪ --Product Launches & Innovations ▪ 45
Competitor Profile RPC Group Plc SEGMENTAL REVENUE BREAKDOWN KEY FINANCIAL INDICATORS & SEGMENTAL ANALYSIS By Business Segment, 2018 Revenue Growth $40 Million 40% $30 Million 30% 35% 70% 60% 80% Segment II Segment IV Segment I Segment III FY2017 FY2018 EBITDA Growth PAT Growth By Geography, 2018 $40 Million 40% $40 Million 40% $30 Million 30% $30 Million 30% FY2017 FY2018 FY2017 FY2018 Asia- Pacific 30% America KEY MANAGEMENT PERSONNEL 50% Dr. PimVervaat Chief Executive Officer XXXXX XXXX EMEA 20% COMPANY HEADQUARTERS LOCATION Rushden, United Kingdom COMPANY CONTACT ADDRESS Sapphire House, Crown Way Rushden, NN10 6FB, United Kingdom+44 (0)1933 416528 46
About Us & Disclaimer TechSci Research is a global market research and consulting company with offices in the US, UK and India. TechSci Research provides market research reports in a number of areas to organizations. The company uses innovative business models that focus on improving productivity, while ensuring creation of high-quality reports. The proprietary forecasting models use various analyses of both industry-specific and macroeconomic variables on a state-by-state basis to produce a unique ‘bottom-up’ model of a country, regional and global industry prospects. Combined with thedetailed analysis of company activity and industry trends, the result is auniquely rich evaluation of theopportunitiesavailablein themarket. Partial List of Clients Related Reports GlobalAdhesives Market, Competition Forecast and Opportunities, 2014-2024 GlobalPaints & Coatings Market, Competition Forecast and Opportunities, 2014– 2024 Global Engineering PlasticsMarket, Competition Forecast & Opportunities, 2014 – 2024 TechSci Research – North America 708 Third Avenue, Manhattan, New York, United States Tel: +1- 646- 360- 1656 Email: sales@techsciresearch.com www.techsciresearch.com TechSci Research – Europe 54, Old brook, Bretton, Peterborough, United Kingdom Email: sales@techsciresearch.com www.techsciresearch.com TechSci Research – Asia-Pacific B – 44, Sector – 57, Noida, National Capital Region, U.P. - India Tel: +91-120-4523900 Email: sales@techsciresearch.com www.techsciresearch.com Disclaimer The contents of this report are based on information generally available to the public from sources believed to be reliable. No representation is made that it is timely, accurate or complete. TechSci Research has taken due care and caution in compilation of data as this hasbeen obtained from various sources including which it considersreliable and first hand. However, TechSci Research does not guarantee the accuracy, adequacy or completeness of any information and it is not responsible for any errors or omissions or for the results obtained from the use of such information and especially states that it has no financial liability whatsoever to the subscribers / users of this report. The information herein, together with all estimates and forecasts, can change without notice. All the figuresprovided in this documentare indicative of relative market size and are strictly for client’s internal consumption.Usage of the same for purpose other than internal will require prior approvalof TechSci Research.