Download
1 / 25
250 likes | 258 Views
Water and wastewater treatment chemicals are polymers used to remove toxic and undesirable components from water and wastewater in order to improve the water quality and render it acceptable for various end use. Industries such as drinking water, irrigation, industrial water supply and recreation generate the highest demand for these chemicals. Industrial sector requires large quantity of water for various processes, thus the treated water can be used within industry itself to lower the cost of water supply and reduce the pressure on water resources.<br>

E N D
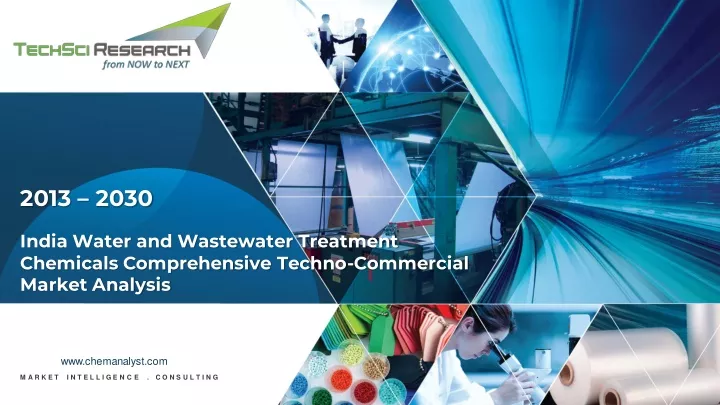
2013 – 2030 India Water and Wastewater Treatment Chemicals Comprehensive Techno-Commercial Market Analysis www.chemanalyst.com M A R K E T I N T E L L I G E N C E . C O N S U L T I N G
Water and wastewater treatment chemicals Product Overview Water and wastewater treatment chemicals are polymers used to remove toxic and undesirable components from water and wastewater in order to improve the water quality and render it acceptable for various end use. Industries such as drinking water, irrigation, industrial water supply and recreation generate the highest demand for these chemicals. Industrial sector requires large quantity of water for various processes, thus the treated water can be used within industry itself to lower the cost of water supply and reduce the pressure on water resources. Industrial sectors including power, textile, chemicals, pharma, pulp & paper, etc., and municipal sectors are the major consumers of water and wastewater treatment chemicals. • Sector Specific Industrial Wastewater Generation- FY2017 Total Units Wastewater Generation (Million Liter Per Day) Type of Industry • Chemical 27 97.8 Distillery 35 37 Food, Dairy & Beverage 22 6.5 Ministry of Environment, Forest and Climate Change is focusing on the effluent treatment program, and proposed commissioning of 218 new sewage treatment plants in various states during 2018-2022. • Pulp & Paper 67 201.4 Sugar Textile, Bleaching & Dyeing Tannery 67 96 India Ministry of Environment has tightened rules and policies, as well as increased environmental standards for wastewater treatment. Industries have been instructed to fulfil the four parameters determining the water quality, namely; pH value, Bio-Chemical Oxygen Demand (BOD), Total Suspended Solids (TSS) and Fecal Coliform (FC) in the treated wastewater. • 63 11.4 442 22.1 Others 41 28.6 Total 764 501 Zero Liquid Discharge Policy is being adopted by industries to eliminate waste from water, thereby minimizing the wastage of water and reusing it into the industrial system itself • 2
INDIA WATER AND WASTEWATER TREATMENT CHEMICALS PRODUCTION OUTLOOK
India Water and Wastewater Treatment Chemicals Production Scenario, 2013- 2030F (000’ Tonnes) India Water and Wastewater Treatment Chemicals Production (Thousand Tonnes) 795.50 776.00 751.15 300.00 300.00 300.00 300.00 300.00 300.00 300.00 300.00 300.00 300.00 300.00 300.00 300.00 300.00 300.00 2013 2014 2015 2016 2017 2018 2019E 2020F 2021F 2022F 2023F 2024F 2025F 2026F 2027F 2028F 2029F 2030F Source: Secondary Research, Expert Interviews, and TechSci Research Analysis xxxxxxxxxxxxxxxxxxxxxxxxxxxxxxxxxxx xxxxxxxxxxxxxxxxxxxxxxxxxxxxxxxxxxxxxxxxxxxxxxxxx • • Note: These are dummy figures; please subscribe our report for actual data 4
India Water and Wastewater Treatment Chemicals Demand-Supply Scenario, 2013- 2030F (000’ Tonnes) Parameters 2013 2014 2015 2016 2017 2018 2019E 2020F 2021F 2022F 2023F 2024F 2025F 2026F 2027F 2028F 2029F 2030F India Water and Wastewater Treatment Chemicals Production (Thousand Tonnes) India Water and Wastewater Treatment Chemicals Import (Thousand Tonnes) India Water and Wastewater Treatment Chemicals Export (Thousand Tonnes) India Water and Wastewater Treatment Chemicals Inventory (Thousand Tonnes) India Water and Wastewater Treatment Chemicals Demand (Thousand Tonnes) India Water and Wastewater Treatment Chemicals Demand (Y-O-Y Growth Rate, %) India Water and Wastewater Treatment Chemicals Demand / Supply Gap (Thousand Tonnes) X X X X X X X X X X X X X X X X X X X X X X X X X X X X X X X X X X X X X X X X X X X X X X X X X X X X X X X X X X X X X X X X X X X X X X X X X X X X X X X X X X X X X X X X X X X X X X X X X Source: Secondary Research, Expert Interviews, and TechSci Research Analysis 1. xxxxxxxxxxxxxxxxxxxxxxxxxxxxxxxxxxx 2. xxxxxxxxxxxxxxxxxxxxxxxxxxxxxxxxxxxxxxxxxxxxxxxxx 3. xxxxxxxxxxxxxxxxxxxxxxxxxxxxxxxxxxxxxxxxxxxxxxxxxxxxxxxxxxxxxxxxxxxxxxxxxxxxxxxxx 4. xxxxxxxxxxxxxxxxxxxxxxxxxxxxxxxxxxxxxxxxxxxxxxxxxxxxxxxxxxxxxxxxxxxxxxxxxxxxxxxxxxxxxxxxxxxxxxxxxxxxxxxxxxxx Note: These are dummy figures; please subscribe our report for actual data 5
India Water and Wastewater Treatment Chemicals Trade Dynamics, 2013-2019 (Value in INR Million & Volume in 000’ Tonnes) Country 2013 2014 2015 2016 2017 2018 2019 (Till October 2018) Export Value X X X X X X X X X X X X Volume X X X X X X X X X X X X Value X X X X X X X X X X X X Volume X X X X X X X X X X X X Value X X X X X X X X X X X X Volume X X X X X X X X X X X X Value X X X X X X X X X X X X Volume X X X X X X X X X X X X Value X X X X X X X X X X X X Volume X X X X X X X X X X X X Value X X X X X X X X X X X X Volume X X X X X X X X X X X X Value X X X X X X X X X X X X Volume X X X X X X X X X X X X Bangladesh Vietnam Nepal Thailand Sri Lanka United Arab Emirates Uganda Kenya Malaysia Saudi Arabia Others Total Source: Secondary Research and TechSci Research Analysis Others includes Cameroon, Ethiopia, Maldives, Spain, etc. Country 2013 2014 2015 2016 2017 2018 2019 (Till October 2018) Import Value X X X X X X X X X X X X Volume X X X X X X X X X X X X Value X X X X X X X X X X X X Volume X X X X X X X X X X X X Value X X X X X X X X X X X X Volume X X X X X X X X X X X X Value X X X X X X X X X X X X Volume X X X X X X X X X X X X Value X X X X X X X X X X X X Volume X X X X X X X X X X X X Value X X X X X X X X X X X X Volume X X X X X X X X X X X X Value X X X X X X X X X X X X Volume X X X X X X X X X X X X China Thailand South Korea U S A Spain Japan Singapore Netherland Germany Canada Others Total Source: Secondary Research and TechSci Research Analysis Others includes Austria, Belgium, Taiwan, Italy, etc. 6 Note: These are dummy figures; please subscribe our report for actual data
WATER AND WASTEWATER TREATMENT CHEMICALS DEMAND ANALYSIS
India Water and Wastewater Treatment Chemicals Demand Market Share, By End Use, 2013-2030F (%) Muncipal Oil & Gas Power Chemical & Fertilizer Others 2030F 55.00% 11.51% 9.78% 16.71% 7.00% 2029F 55.00% 11.50% 9.75% 16.75% 7.00% 2028F 55.00% 11.46% 9.70% 16.66% 7.18% 2027F 55.00% 11.43% 9.65% 16.56% 7.36% 2026F 55.00% 11.40% 9.60% 16.45% 7.55% 2025F 55.00% 11.37% 9.55% 16.35% 7.73% 2024F 55.00% 11.34% 9.50% 16.24% 7.92% 2023F 55.00% 11.30% 9.46% 16.14% 8.10% 2022F 55.00% 11.27% 9.41% 16.03% 8.29% 2021F 55.00% 11.24% 9.36% 15.92% 8.48% 2020F 55.00% 11.21% 9.32% 15.80% 8.67% 2019E 55.00% 11.18% 9.27% 15.70% 8.85% 2018 55.00% 11.15% 9.22% 15.59% 9.04% 2017 55.00% 11.12% 9.18% 15.47% 9.23% 2016 55.00% 11.09% 9.13% 15.36% 9.42% 2015 55.00% 11.06% 9.09% 15.24% 9.61% 2014 55.00% 11.03% 9.04% 15.13% 9.80% 2013 55.00% 11.00% 9.00% 15.00% 10.00% Source: Secondary Research, Expert Interviews, and TechSci Research Analysis Others includes Pharmaceutical, Food and beverage, Automotive etc. Note: These are dummy figures; please subscribe our report for actual data xxxxxxxxxxxxxxxxxxxxxxxxxxxxxxxxxxx xxxxxxxxxxxxxxxxxxxxxxxxxxxxxxxxxxxxxxxxxxxxxxxxx • • 8
India Water and Wastewater Treatment Chemicals Demand Market Share, By Type, 2013-2030F (%) Corrosion & Scale Inhibitors Biocides & Disinfectants pH Regulators Defoamers Flocculants & Coagulatants Others 2030F 40.00% 11.51% 9.78% 16.71% 7.00% 15.00% 2029F 40.00% 11.50% 9.75% 16.75% 7.00% 15.00% 2028F 40.00% 11.46% 9.70% 16.66% 7.18% 15.00% 2027F 40.00% 11.43% 9.65% 16.56% 7.36% 15.00% 2026F 40.00% 11.40% 9.60% 16.45% 7.55% 15.00% 2025F 40.00% 11.37% 9.55% 16.35% 7.73% 15.00% 2024F 40.00% 11.34% 9.50% 16.24% 7.92% 15.00% 2023F 40.00% 11.30% 9.46% 16.14% 8.10% 15.00% 2022F 40.00% 11.27% 9.41% 16.03% 8.29% 15.00% 2021F 40.00% 11.24% 9.36% 15.92% 8.48% 15.00% 2020F 40.00% 11.21% 9.32% 15.80% 8.67% 15.00% 2019E 40.00% 11.18% 9.27% 15.70% 8.85% 15.00% 2018 40.00% 11.15% 9.22% 15.59% 9.04% 15.00% 2017 40.00% 11.12% 9.18% 15.47% 9.23% 15.00% 2016 40.00% 11.09% 9.13% 15.36% 9.42% 15.00% 2015 40.00% 11.06% 9.09% 15.24% 9.61% 15.00% 2014 40.00% 11.03% 9.04% 15.13% 9.80% 15.00% 2013 40.00% 11.00% 9.00% 15.00% 10.00% 15.00% Source: Secondary Research, Expert Interviews, and TechSci Research Analysis Others includes Bleaching Powder, Sodium Hexametaphosphate, Copper Sulfate, etc Note: These are dummy figures; please subscribe our report for actual data xxxxxxxxxxxxxxxxxxxxxxxxxxxxxxxxxxx xxxxxxxxxxxxxxxxxxxxxxxxxxxxxxxxxxxxxxxxxxxxxxxxx • • 9
India Water and Wastewater Treatment Chemicals Demand Market Share, By Sales Channel, 2013- 2030F (%) Direct Company Sale Direct Import Distributors Retailers 2019E 61.00% 20.00% 15.00% 4.00% 2018 61.00% 20.00% 15.00% 4.00% 2017 61.00% 20.00% 15.00% 4.00% 2016 61.00% 20.00% 15.00% 4.00% 2015 61.00% 20.00% 15.00% 4.00% 2014 61.00% 20.00% 15.00% 4.00% 2013 61.00% 20.00% 15.00% 4.00% Source: Secondary Research, Expert Interviews, and TechSci Research Analysis Note: These are dummy figures; please subscribe our report for actual data xxxxxxxxxxxxxxxxxxxxxxxxxxxxxxxxxxx xxxxxxxxxxxxxxxxxxxxxxxxxxxxxxxxxxxxxxxxxxxxxxxxx • • 10
India Water and Wastewater Treatment Chemicals Demand Market Share, By Region, 2013 & 2015 (%) South North 20.10 % 2015 31.84% 2015 20.37% 2013 31.62% 2013 East West 10.83 % 2015 37.23% 2015 37.36 % 2013 10.65% 2013 Source: Secondary Research, Expert Interviews, and TechSci Research Analysis Note: These are dummy figures; please subscribe our report for actual data xxxxxxxxxxxxxxxxxxxxxxxxxxxxxxxxxxx xxxxxxxxxxxxxxxxxxxxxxxxxxxxxxxxxxxxxxxxxxxxxxxxx • • 11
India Water and Wastewater Treatment Chemicals Demand Market Share, By Company, 2018 (%) 15.00% 35.00% 25.00% 15.00% 10.00% Total NALCO Water India Ltd SUEZ India Pvt. Ltd Ion Exchange India Ltd. Thermax India Ltd Others Source: Secondary Research, Expert Interviews, and TechSci Research Analysis Others includes Chembond Chemicals Ltd., Vasu Chemicals, Solenis India Ltd., BASF India Ltd. Dew Speciality Chemicals Pvt Ltd, Vishnu chemicals limited, Sicagen India Ltd, Kemira • xxxxxxxxxxxxxxxxxxxxxxxxxxxxxxxxxxx • xxxxxxxxxxxxxxxxxxxxxxxxxxxxxxxxxxxxxxxxxxxxxxxxx Note: These are dummy figures; please subscribe our report for actual data 12
WATER AND WASTEWATER TREATMENT CHEMICALS CUSTOMER ANALYSIS
Partial List of Major Water and Wastewater Treatment Chemicals Customers in India Company Name Location Product Applications Average Monthly Consumption (Tonnes) 2500 Bhandup WTP Mumbai Water Treatment Plant 398 Indira Gandhi WTP Kolkata Water Treatment Plant 359 Haiderpur WTP Delhi Water Treatment Plant XX XX XX XX XX XX XX XX XX XX XX XX XX XX XX XX XX XX XX XX XX XX XX XX XX XX XX XX XX XX XX XX Source: Secondary Research, Expert Interviews, and TechSci Research Analysis 14
WATER AND WASTEWATER TREATMENT CHEMICALS PRICING ANALYSIS
India Water and Wastewater Treatment Chemicals (Bulk) Daily Prices, 15/02/2019-04/03/2019 (INR/kg) 110 110 110 110 105 105 105 105 105 105 105 105 105 105 105 105 105 105 105 100 100 100 100 100 100 100 100 100 100 100 100 100 100 100 95 95 95 95 95 95 95 95 95 95 95 95 95 95 95 90 90 90 90 90 90 90 90 90 90 90 90 90 90 90 85 85 85 85 85 85 85 85 85 85 85 85 85 85 85 80 80 80 80 80 80 80 80 80 80 80 80 80 80 80 75 75 75 75 75 75 75 75 75 75 75 15/02/2019 18/02/2019 19/02/2019 20/02/2019 21/02/2019 22/02/2019 25/02/2019 26/02/2019 27/02/2019 28/02/2019 29/02/2019 1/3/2019 2/3/2019 3/3/2019 4/3/2019 Aluminium Sulphate Liquid chlorine Ferric Chloride Ferric Sulphate Poly Ammonium Chloride Caustic Soda Sulphuric Acid Xxxxxxxxxxxxxxxxxxxxxxxxxxxxxxxxxxxxxxxxxxxxxxxxx xxxxxxxxxxxxxxxxxxxxxxxxxxxxxxxxxxxxxxxxxxxxxxxxx xxxxxxxxxxxxxxxxxxxxxxxxxxxxxxxxxxxxxxxxxxxxxxxxx • • • Source: Expert Interviews, and TechSci Research Analysis 16
India Water and Wastewater Treatment Chemicals Monthly Prices, July 2018-Feburary2019 (INR/kg) 105 105 105 105 105 105 105 105 100 100 100 100 100 100 100 100 95 95 95 95 95 95 95 95 90 90 90 90 90 90 90 90 85 85 85 85 85 85 85 85 80 80 80 80 80 80 80 80 75 75 75 75 75 75 75 75 July, 2018 August, 2018 September, 2018 October, 2018 November, 2018 December, 2018 January, 2019 Feburary, 2019 Aluminium Sulphate Liquid chlorine Ferric Chloride Ferric Sulphate Poly Ammonium Chloride Caustic Soda Sulphuric Acid Note: These are dummy figures; please subscribe our report for actual data Source: Expert Interviews, and TechSci Research Analysis 17
India Water and Wastewater Treatment Chemicals Quarterly Prices, Q4 2018-Q4 2019 (INR/kg) 105 105 105 105 105 100 100 100 100 100 95 95 95 95 95 90 90 90 90 90 85 85 85 85 85 80 80 80 80 80 75 75 75 75 75 Q4, 2018 Q1, 2019 Q2, 2019 Q3, 2019 Q4, 2019 Aluminium Sulphate Liquid chlorine Ferric Chloride Ferric Sulphate Poly Ammonium Chloride Caustic Soda Sulphuric Acid Note: These are dummy figures; please subscribe our report for actual data Source: Expert Interviews, and TechSci Research Analysis 18
India Water and Wastewater Treatment Chemicals Yearly Prices, 2013-2030F (INR/kg) 110 110 110 110 110 110 110 105 105 105 105 105 105 105 105 105 105 105 105 105 105 105 105 105 105 100 100 100 100 100 100 100 100 100 100 100 100 100 100 100 100 100 100 95 95 95 95 95 95 95 95 95 95 95 95 95 95 95 95 95 95 90 90 90 90 90 90 90 90 90 90 90 90 90 90 90 90 90 90 85 85 85 85 85 85 85 85 85 85 85 85 85 85 85 85 85 85 80 80 80 80 80 80 80 80 80 80 80 80 80 80 80 80 80 80 75 75 75 75 75 75 75 75 75 75 75 2013 2014 2015 2016 2017 2018 2019E 2020F 2021F 2022F 2023F 2024F 2025F 2026F 2027F 2028F 2029F 2030F Aluminium Sulphate Liquid chlorine Ferric Chloride Ferric Sulphate Poly Ammonium Chloride Caustic Soda Sulphuric Acid Source: Expert Interviews, and TechSci Research Analysis xxxxxxxxxxxxxxxxxxxxxxxxxxxxxxxxxxx xxxxxxxxxxxxxxxxxxxxxxxxxxxxxxxxxxxxxxxxxxxxxxxxx • Source: XXXXX • Note: These are dummy figures; please subscribe our report for actual data 19
WATER AND WASTEWATER TREATMENT CHEMICALS NEWS & DEALS
India Water and Wastewater Treatment Chemicals Recent News 1 2 23rdJanuary 2019: VA Tech Wabag Received Order from Mangalore Refineryand Petrochemicals Limited (MRPL) 31stJanuary 2019: Gradient Corporation Awarded Four Water Recycling Projects Gradient Corporation, one of the leaders in wastewater cleaning technology, received four water recycling projects in India via its subsidiary company Gradient India Pvt Ltd. The company is known for its innovative solutions in the wastewater technology domain. These projects are zero liquid discharge projects from dyestuff, alkali-chemical manufacturing, textile processing and pharmaceutical industries. The company is aiming to treat wastewater from 100 to 4000 kiloliters per day. xxxxxxxxxxxxxxxxxxxxxxxxxxxxxxxxxxxxxxxxxxxxxxxxxxxx 3 4 xxxxxxxxxxxxxxxxxxxxxxxxxxxxxxxxxxxxxxxx xxxxxxxxxxxxxxxxxxxxxxxxxxxxxxxxxxxxxxxxxxxxxxxxxxxxxxxxx xxxxxxxxxxxxxxxxxxxxxxxxxxxxxxxxxxxxxxxxxxxxxxxxxxxxxxxxxxxxxxxxxxxxxxxxxxxxxxxxx xxxx xxxxxxxxxxxxxxxxxxxxxxxxxxxxxxxxxxxxxxxxxxxxxxxxxxxxxxxxxxxxx Source: Secondary Research 21
COMPETITIVE INTELLIGENCE
Competitor Profile Ion Exchange India Limited Financials (INR Millions) Basic Details Particulars 2018 2017 Name of the Company Ion Exchange India Limited Revenues 9942.50 9626.30 Registration Date 06.03.1964 CIN L74999MH1964PLC014258 % Growth 3.28% 16.23% PBT Category/Sub-category of the Company 728.30 713.00 Company limited by Shares % margin 7.33% 7.41% Address of the Registered Office Ion House, Dr. E. Moses Road, Mahalaxmi, Mumbai - 400 011 PAT 477.50 470.00 % margin 4.80% 4.88% Tel.No.: +91-22-39890909 / 30472042 Fax: +91-22-2493 8737 E mail: ieil@ionexchange.co.in Website: www.ionindia.com Contact details Major Products & Segmental Revenue Information, 2018 Number of Employee (FY2018) 2562-3000 Managing Director/CEO Rajesh Sharma 32.00% Engineering Expansion Plans Chemicals 10.00% 2018 XXXXXXXXXXXXXXXXXXXXXXXXXXXXXXXXXXXXXXXXXXXXXXXXXXXXXXXXXXXXXXXXXX. Consumers Product 58.00% Source: Secondary Research, Expert Interviews, and TechSci Research Analysis Others include Food Ingredients and Fine Chemicals, etc. 23
Competitor Profile Ion Exchange India Limited Strong domestic and international presence and enjoys the privilege of being one-stop shop for all types of water solutions chemicals. Volatile market and changes in government norms and regulations. • • •Strong focus on R&D activities with over 50 patents and more than 100 new products launched by the organization. Focus on R&D KEY STRATEGIES S W STRENGTHS WEAKNESSES •The company is focusing to cater the increase in demand for membraneand resin technology. Growth Strategy OPPORTUNITIES THREATS O T •The company has introduced water surface treatment chemical in association with State Rural Water Supply Departments and The Public Departments (PHEDs). Opportunity for export of specialty chemicals, industrial chemicals in European, African, UK, USA and Middle East market. • Strategic Tie-Up Health Engineering Stiff competition from China import market. • 24
About Us & Disclaimer CHEMANALYST.COM is a one stop comprehensive digital platform for the market intelligence report on chemical & petrochemical industry. Our aim is to provide competitive advantage to industry stakeholders by offering valuable information and analysis that help our customer to create a great opportunity for their business. ChemAnalyst’ team of 100+ analyst is engaged in tracking capacity (by company, by location, by technology, by process), production, demand (by end use, by type, by sales channel, by region), demand-supply scenario (total demand, inventory, demand-supply gap), plant operation, foreign trade (top ten countries), major customers and news/deals. ChemAnalyst brings you real time daily/ monthly/ quarterly/ yearly prices of major chemicals & petrochemicals that gives you a competitive advantage in price negotiations with suppliers and traders. We are committed to deliver quality in whatever we do. Partial List of Clients Related Reports India HDPE Comprehensive Techno-Commercial Market Analysis, 2030 India Polycarbonate Comprehensive Techno-Commercial Market Analysis, 2030 India Leather Chemicals Comprehensive Techno-Commercial Market Analysis, 2030 India Water Soluble Fertilizers Comprehensive Techno-Commercial Market Analysis, 2030 India Methanol Comprehensive Techno-Commercial Market Analysis, 2030 India PVC Comprehensive Techno-Commercial Market Analysis, 2030 ChemAnalyst – Europe 54, Old brook, Bretton, Peterborough, United Kingdom Email: sales@chemanalyst.com www.chemanalyst.com ChemAnalyst – Asia-Pacific B – 44, Sector – 57, Noida, National Capital Region, U.P. - India Tel: +91-120-4523900 Email: sales@chemanalyst.com www.chemanalyst.com ChemAnalyst– North America 708 Third Avenue, Manhattan, New York, United States Tel: +1- 646- 360- 1656 Email: sales@chemanalyst.com www.chemanalyst.com Disclaimer The contents of this report are based on information generally available to the public from sources believed to be reliable. No representation is made that it is timely, accurate or complete. TechSci Research has taken due care and caution in compilation of data as this has been obtained from various sources includingwhich it considers reliable and first hand. However, TechSci Research does not guarantee the accuracy, adequacy or completeness of any information and it is not responsible for any errors or omissions or for the results obtained from the use of such information and especially states that ithas no financial liability whatsoever to the subscribers / users of this report.The information herein, together with all estimates and forecasts, can change without notice. All the figures provided in this document are indicative of relative market size and are strictly for client’s internal consumption. Usage of thesame forpurposeotherthan internal will requirepriorapproval of TechSciResearch.