Download

1 / 33
330 likes | 338 Views
HDPE is a linear polymer with the chemical composition of polymethylene, (CH2)n. The first commercial processes for HDPE manufacture were developed in the early 1950s and utilized a variety of transition-metal polymerization catalysts based on molybdenum, chromium, and titanium. Commercial production of HDPE was started in 1956 in the United States by Phillips Petroleum Company and in Europe by Hoechst. The term HDPE embraces a large variety of products differing predominantly in molecular weight, molecular weight distribution (MWD), and crystallinity<br>

E N D
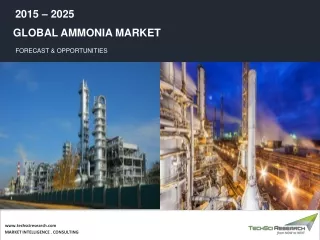
2013 – 2030 India HDPE (Comprehensive Techno- Commercial) Market Analysis and Forecast www.techsciresearch.com M A R K E T I N T E L L I G E N C E . C O N S U L T I N G
HDPE Product Overview HDPE is a linear polymer with the chemical composition of polymethylene, (CH2)n. The first commercial processes for HDPE manufacture were developed in the early 1950s and utilized a variety of transition- metal polymerization catalysts based on molybdenum, chromium, and titanium. Commercial production of HDPE was started in 1956 in the United States by Phillips Petroleum Company and in Europe by Hoechst. The term HDPE embraces a large variety of products differing predominantly in molecular weight, molecular weight distribution (MWD), and crystallinity • High Density Polyethylene (HDPE) is defined by ASTM D1248-84 as a polymerization with a density of 0.940 g/cm3 or higher. This range includes both homopolymers of ethylene and its copolymers with small amounts of α-olefins. product of ethylene The range of molecular weights of commercially produced HDPE is wide, from several hundred for polyethylene (PE) waxes to several millions for ultrahigh molecular weight PE resins (UHMWPE). A parameter that is widely accepted, easily measured, and which provides information on molecular weight, is the rheological parameter called the melt index. The melt index value, which is reciprocally related to mol wt, gives the weight of a molten resin flowing at 190°C for 10 min through a capillary die under a particular melt pressure. Different HDPE resins have melt indexes ranging from over 500 (low molecular weight polymers) to less than 0.001. • The major companies operating in domestic market are Reliance Industries Ltd. Gail Limited, Indian Oil Corporation Ltd., Haldia Petrochemicals Limited, ONGC Petro additions Limited and Brahmaputra Cracker and Polymer Limited, etc. • 2
INDIA HDPE PRODUCTION OUTLOOK
India HDPE Capacity, By Company, 2013-2030F (000’ Tonnes) Company Reliance Industries Limited 2013 2014 2015 2016 2017 2018 2019E 2020F 2021F 2022F 2023F 2024F 2025F 2026F 2027F 2028F 2029F 2030F XX XX XX XX XX XX XX XX XX XX XX XX XX XX XX XX XX XX GAIL (India) Limited XX XX XX XX XX XX XX XX XX XX XX XX XX XX XX XX XX XX ONGC Petro additions Limited XX XX XX XX XX XX XX XX XX XX XX XX XX XX XX XX XX XX Indian Oil Corporation Limited XX XX XX XX XX XX XX XX XX XX XX XX XX XX XX XX XX XX Haldia Petrochemicals Limited XX XX XX XX XX XX XX XX XX XX XX XX XX XX XX XX XX XX Brahmaputra Cracker and Polymers Limited XX XX XX XX XX XX XX XX XX XX XX XX XX XX XX XX XX XX Source: Secondary Research, Expert Interviews, and TechSci Research Analysis Assumptions: Actual capacity forecast are those capacity which are in construction phase or received environment clearance. 1. XXXXXXXXXXXXXXXXXXXXXXXXXXXXXXXXXXXXXXXXXXXXXXXXXXXXXXXXXXXXXX 2. XXXXXXXXXXXXXXXXXXXXXXXXXXXXXXXXXXXXXXXXXXXXXXXXXXXXXXXXXXXXXXXXXXXXXXXXXXXXXXXX 3. XXXXXXXXXXXXXXXXXXXXXXXXXXXXXXXXXXXXXXXXXXXXXXXXXXXXXXXXXXXXXXXXXXXXXXXXXXXXXXXXXXXXXXXXXXXXXXXXXXX Note: These are dummy figures; please subscribe our report for actual data 4
India HDPE Capacity, By Location, 2013-2030F (000’ Tonnes) Company Brahmaputra Cracker and Polymers Limited GAIL (India) Limited: L1 Location State 2013 2014 2015 2016 2017 2018 2019E 2020F 2021F 2022F 2023F 2024F 2025F 2026F 2027F 2028F 2029F 2030F Lapetkata Assam XX XX XX XX XX XX XX XX XX XX XX XX XX XX XX XX XX XX Pata Uttar Pradesh XX XX XX XX XX XX XX XX XX XX XX XX XX XX XX XX XX XX GAIL (India) Limited: L2 Pata Uttar Pradesh XX XX XX XX XX XX XX XX XX XX XX XX XX XX XX XX XX XX GAIL (India) Limited: L3 Pata Uttar Pradesh XX XX XX XX XX XX XX XX XX XX XX XX XX XX XX XX XX XX GAIL (India) Limited: L3 Pata Uttar Pradesh XX XX XX XX XX XX XX XX XX XX XX XX XX XX XX XX XX XX GAIL (India) Limited: L4 Pata Uttar Pradesh XX XX XX XX XX XX XX XX XX XX XX XX XX XX XX XX XX XX GAIL (India) Limited: L5 Pata Uttar Pradesh XX XX XX XX XX XX XX XX XX XX XX XX XX XX XX XX XX XX GAIL (India) Limited: L6 Pata Uttar Pradesh XX XX XX XX XX XX XX XX XX XX XX XX XX XX XX XX XX XX GAIL (India) Limited: L7 Pata Uttar Pradesh XX XX XX XX XX XX XX XX XX XX XX XX XX XX XX XX XX XX Haldia Petrochemicals Limited: L1 Haldia West Bengal XX XX XX XX XX XX XX XX XX XX XX XX XX XX XX XX XX XX Haldia Petrochemicals Limited: L2 Haldia West Bengal XX XX XX XX XX XX XX XX XX XX XX XX XX XX XX XX XX XX Haldia Petrochemicals Limited: L3 Haldia West Bengal XX XX XX XX XX XX XX XX XX XX XX XX XX XX XX XX XX XX Haldia Petrochemicals Limited: L4 Haldia West Bengal XX XX XX XX XX XX XX XX XX XX XX XX XX XX XX XX XX XX Indian Oil Corporation Limited: L1 Panipat Haryana XX XX XX XX XX XX XX XX XX XX XX XX XX XX XX XX XX XX Indian Oil Corporation Limited: L2 Panipat Haryana XX XX XX XX XX XX XX XX XX XX XX XX XX XX XX XX XX XX Indian Oil Corporation Limited: L3 Panipat Haryana XX XX XX XX XX XX XX XX XX XX XX XX XX XX XX XX XX XX ONGC Petro additions Limited: L1 Dahej Gujarat XX XX XX XX XX XX XX XX XX XX XX XX XX XX XX XX XX XX ONGC Petro additions Limited: L2 Dahej Gujarat XX XX XX XX XX XX XX XX XX XX XX XX XX XX XX XX XX XX ONGC Petro additions Limited: L3 Dahej Gujarat XX XX XX XX XX XX XX XX XX XX XX XX XX XX XX XX XX XX ONGC Petro additions Limited: L4 Dahej Gujarat XX XX XX XX XX XX XX XX XX XX XX XX XX XX XX XX XX XX Reliance Industries Limited: L1 Hazira Gujarat XX XX XX XX XX XX XX XX XX XX XX XX XX XX XX XX XX XX Reliance Industries Limited: L2 Jamnagar Gujarat XX XX XX XX XX XX XX XX XX XX XX XX XX XX XX XX XX XX Reliance Industries Limited: L3 Hazira Gujarat XX XX XX XX XX XX XX XX XX XX XX XX XX XX XX XX XX XX Reliance Industries Limited: L4 Gandhar Gujarat XX XX XX XX XX XX XX XX XX XX XX XX XX XX XX XX XX XX Reliance Industries Limited: L5 Gandhar Gujarat XX XX XX XX XX XX XX XX XX XX XX XX XX XX XX XX XX XX Source: Secondary Research, Expert Interviews, and TechSci Research Analysis 5 Note: These are dummy figures; please subscribe our report for actual data
India HDPE Capacity, By Technology, 2013-2030F (000’ Tonnes) Technolog y Company Licensor 2013 2014 2015 2016 2017 2018 2019E 2020F 2021F 2022F 2023F 2024F 2025F 2026F 2027F 2028F 2029F 2030F Brahmaputra Cracker and Polymers Limited XX XX XX XX XX XX XX XX XX XX XX XX XX XX XX XX XX XX Gas Phase Innovene XX XX XX XX XX XX XX XX XX XX XX XX XX XX XX XX XX XX GAIL (India) Limited: L1 Slurry Tank Mitsui XX XX XX XX XX XX XX XX XX XX XX XX XX XX XX XX XX XX GAIL (India) Limited: L2 Slurry Tank Mitsui XX XX XX XX XX XX XX XX XX XX XX XX XX XX XX XX XX XX GAIL (India) Limited: L3 Slurry Tank Mitsui XX XX XX XX XX XX XX XX XX XX XX XX XX XX XX XX XX XX GAIL (India) Limited: L3 Slurry Tank Mitsui XX XX XX XX XX XX XX XX XX XX XX XX XX XX XX XX XX XX GAIL (India) Limited: L4 Slurry Tank Mitsui XX XX XX XX XX XX XX XX XX XX XX XX XX XX XX XX XX XX GAIL (India) Limited: L5 Slurry Tank Mitsui XX XX XX XX XX XX XX XX XX XX XX XX XX XX XX XX XX XX GAIL (India) Limited: L6 Solution Sclairtech XX XX XX XX XX XX XX XX XX XX XX XX XX XX XX XX XX XX GAIL (India) Limited: L7 Haldia Petrochemicals Limited: L1 Haldia Petrochemicals Limited: L2 Haldia Petrochemicals Limited: L3 Haldia Petrochemicals Limited: L4 Indian Oil Corporation Limited: L1 Indian Oil Corporation Limited: L2 Indian Oil Corporation Limited: L3 Gas Phase Unipol XX XX XX XX XX XX XX XX XX XX XX XX XX XX XX XX XX XX Gas Phase Unipol XX XX XX XX XX XX XX XX XX XX XX XX XX XX XX XX XX XX Slurry Tank Mitsui XX XX XX XX XX XX XX XX XX XX XX XX XX XX XX XX XX XX Slurry Tank Mitsui XX XX XX XX XX XX XX XX XX XX XX XX XX XX XX XX XX XX Gas Phase Spherilene S XX XX XX XX XX XX XX XX XX XX XX XX XX XX XX XX XX XX Gas Phase Spherilene S XX XX XX XX XX XX XX XX XX XX XX XX XX XX XX XX XX XX Slurry Tank Hostalen XX XX XX XX XX XX XX XX XX XX XX XX XX XX XX XX XX XX Slurry Tank Hostalen XX XX XX XX XX XX XX XX XX XX XX XX XX XX XX XX XX XX ONGC Petro additions Limited: L1 Solution Sclairtech XX XX XX XX XX XX XX XX XX XX XX XX XX XX XX XX XX XX ONGC Petro additions Limited: L2 Slurry Tank Mitsui XX XX XX XX XX XX XX XX XX XX XX XX XX XX XX XX XX XX ONGC Petro additions Limited: L3 Slurry Tank Mitsui XX XX XX XX XX XX XX XX XX XX XX XX XX XX XX XX XX XX ONGC Petro additions Limited: L4 Gas Phase Innovene XX XX XX XX XX XX XX XX XX XX XX XX XX XX XX XX XX XX Reliance Industries Limited: L1 Gas Phase Innovene XX XX XX XX XX XX XX XX XX XX XX XX XX XX XX XX XX XX Reliance Industries Limited: L2 Solution Sclairtech XX XX XX XX XX XX XX XX XX XX XX XX XX XX XX XX XX XX Reliance Industries Limited: L3 Solution Sclairtech XX XX XX XX XX XX XX XX XX XX XX XX XX XX XX XX XX XX Reliance Industries Limited: L4 Slurry Tank Hostalen XX XX XX XX XX XX XX XX XX XX XX XX XX XX XX XX XX XX Reliance Industries Limited: L5 Slurry Tank Hostalen Source: Secondary Research, Expert Interviews, and TechSci Research Analysis 6 Note: These are dummy figures; please subscribe our report for actual data
India HDPE Capacity, By Process, 2013-2030F (000’ Tonnes) Company Brahmaputra Cracker and Polymers Limited GAIL (India) Limited: L1 Process Licensor 2013 2014 2015 2016 2017 2018 2019E 2020F 2021F 2022F 2023F 2024F 2025F 2026F 2027F 2028F 2029F 2030F Swing PE Innovene XX XX XX XX XX XX XX XX XX XX XX XX XX XX XX XX XX XX HDPE Mitsui XX XX XX XX XX XX XX XX XX XX XX XX XX XX XX XX XX XX GAIL (India) Limited: L2 HDPE Mitsui XX XX XX XX XX XX XX XX XX XX XX XX XX XX XX XX XX XX GAIL (India) Limited: L3 HDPE Mitsui XX XX XX XX XX XX XX XX XX XX XX XX XX XX XX XX XX XX GAIL (India) Limited: L3 HDPE Mitsui XX XX XX XX XX XX XX XX XX XX XX XX XX XX XX XX XX XX GAIL (India) Limited: L4 HDPE Mitsui XX XX XX XX XX XX XX XX XX XX XX XX XX XX XX XX XX XX GAIL (India) Limited: L5 Swing PE Mitsui XX XX XX XX XX XX XX XX XX XX XX XX XX XX XX XX XX XX GAIL (India) Limited: L6 Swing PE Sclairtech XX XX XX XX XX XX XX XX XX XX XX XX XX XX XX XX XX XX GAIL (India) Limited: L7 Haldia Petrochemicals Limited: L1 Haldia Petrochemicals Limited: L2 Haldia Petrochemicals Limited: L3 Haldia Petrochemicals Limited: L4 Indian Oil Corporation Limited: L1 Indian Oil Corporation Limited: L2 Indian Oil Corporation Limited: L3 ONGC Petro additions Limited: L1 ONGC Petro additions Limited: L2 ONGC Petro additions Limited: L3 ONGC Petro additions Limited: L4 Reliance Industries Limited: L1 Swing PE Unipol XX XX XX XX XX XX XX XX XX XX XX XX XX XX XX XX XX XX HDPE Unipol XX XX XX XX XX XX XX XX XX XX XX XX XX XX XX XX XX XX HDPE Mitsui XX XX XX XX XX XX XX XX XX XX XX XX XX XX XX XX XX XX Swing PE Mitsui XX XX XX XX XX XX XX XX XX XX XX XX XX XX XX XX XX XX Swing PE Spherilene S XX XX XX XX XX XX XX XX XX XX XX XX XX XX XX XX XX XX HDPE Spherilene S XX XX XX XX XX XX XX XX XX XX XX XX XX XX XX XX XX XX HDPE Hostalen XX XX XX XX XX XX XX XX XX XX XX XX XX XX XX XX XX XX Swing PE Hostalen XX XX XX XX XX XX XX XX XX XX XX XX XX XX XX XX XX XX HDPE Sclairtech XX XX XX XX XX XX XX XX XX XX XX XX XX XX XX XX XX XX HDPE Mitsui XX XX XX XX XX XX XX XX XX XX XX XX XX XX XX XX XX XX Swing PE Mitsui XX XX XX XX XX XX XX XX XX XX XX XX XX XX XX XX XX XX Swing PE Innovene XX XX XX XX XX XX XX XX XX XX XX XX XX XX XX XX XX XX Swing PE Innovene XX XX XX XX XX XX XX XX XX XX XX XX XX XX XX XX XX XX Reliance Industries Limited: L2 Swing PE Sclairtech XX XX XX XX XX XX XX XX XX XX XX XX XX XX XX XX XX XX Reliance Industries Limited: L3 Swing PE Sclairtech XX XX XX XX XX XX XX XX XX XX XX XX XX XX XX XX XX XX Reliance Industries Limited: L4 HDPE Hostalen XX XX XX XX XX XX XX XX XX XX XX XX XX XX XX XX XX XX Reliance Industries Limited: L5 HDPE Hostalen XX XX XX XX XX XX XX XX XX XX XX XX XX XX XX XX XX XX Source: Secondary Research, Expert Interviews, and TechSci Research Analysis 7 Note: These are dummy figures; please subscribe our report for actual data
India HDPE Production, By Company, 2013-2030F (000’ Tonnes) Company 2013 2014 2015 2016 2017 2018 2019E 2020F 2021F 2022F 2023F 2024F 2025F 2026F 2027F 2028F 2029F 2030F Reliance Industries Limited XX XX XX XX XX XX XX XX XX XX XX XX XX XX XX XX XX XX GAIL (India) Limited XX XX XX XX XX XX XX XX XX XX XX XX XX XX XX XX XX XX ONGC Petro additions Limited XX XX XX XX XX XX XX XX XX XX XX XX XX XX XX XX XX XX Indian Oil Corporation Limited XX XX XX XX XX XX XX XX XX XX XX XX XX XX XX XX XX XX Haldia Petrochemicals Limited XX XX XX XX XX XX XX XX XX XX XX XX XX XX XX XX XX XX Brahmaputra Cracker and Polymers Limited XX XX XX XX XX XX XX XX XX XX XX XX XX XX XX XX XX XX Source: Secondary Research, Expert Interviews, and TechSci Research Analysis 8 Note: These are dummy figures; please subscribe our report for actual data
India HDPE Plant Operational Efficiency, By Company, 2013-2030F (%) Company 2013 2014 2015 2016 2017 2018 2019E 2020F 2021F 2022F 2023F 2024F 2025F 2026F 2027F 2028F 2029F 2030F Reliance Industries Limited XX XX XX XX XX XX XX XX XX XX XX XX XX XX XX XX XX XX GAIL (India) Limited XX XX XX XX XX XX XX XX XX XX XX XX XX XX XX XX XX XX ONGC Petro additions Limited XX XX XX XX XX XX XX XX XX XX XX XX XX XX XX XX XX XX Indian Oil Corporation Limited XX XX XX XX XX XX XX XX XX XX XX XX XX XX XX XX XX XX Haldia Petrochemicals Limited XX XX XX XX XX XX XX XX XX XX XX XX XX XX XX XX XX XX Brahmaputra Cracker and Polymers Limited XX XX XX XX XX XX XX XX XX XX XX XX XX XX XX XX XX XX Source: Secondary Research, Expert Interviews, and TechSci Research Analysis 9 Note: These are dummy figures; please subscribe our report for actual data
India HDPE Production Scenario, 2013-2030F (000’ Tonnes) India HDPE Capacity (Thousand Tonnes) India HDPE Production (Thousand Tonnes) 1000.00 1000.00 1000.00 1000.00 1000.00 1000.00 1000.00 1000.00 1000.00 1000.00 1000.00 1000.00 1000.00 1000.00 1000.00 1000.00 1000.00 1000.00 800.00 800.00 800.00 800.00 800.00 800.00 800.00 800.00 800.00 800.00 800.00 800.00 800.00 800.00 800.00 800.00 800.00 800.00 2013 2014 2015 2016 2017 2018 2019E 2020F 2021F 2022F 2023F 2024F 2025F 2026F 2027F 2028F 2029F 2030F Source: Secondary Research, Expert Interviews, and TechSci Research Analysis 1. XXXXXXXXXXXXXXXXXXXXXXXXXXXXXXXXXXXXXXXXXXXXXXXXXXXXXXXXXXXXXX 2. XXXXXXXXXXXXXXXXXXXXXXXXXXXXXXXXXXXXXXXXXXXXXXXXXXXXXXXXXXXXXXXXXXXXXXXXXXXXXXXX 3. XXXXXXXXXXXXXXXXXXXXXXXXXXXXXXXXXXXXXXXXXXXXXXXXXXXXXXXXXXXXXXXXXXXXXXXXXXXXXXXXXXXXXXXXXXXXXXXXXXX 10 Note: These are dummy figures; please subscribe our report for actual data
India HDPE Demand-Supply Scenario, 2013-2030F (000’ Tonnes) Parameters 2013 2014 2015 2016 2017 2018 2019E 2020F 2021F 2022F 2023F 2024F 2025F 2026F 2027F 2028F 2029F 2030F India HDPE Capacity (Thousand Tonnes) India HDPE Production (Thousand Tonnes) India HDPE Import (Thousand Tonnes) India HDPE Export (Thousand Tonnes) India HDPE Inventory (Thousand Tonnes) India HDPE Demand (Thousand Tonnes) India HDPE Demand (Y-O-Y Growth Rate, %) India HDPE Demand / Supply Gap (Thousand Tonnes) XX XX XX XX XX XX XX XX XX XX XX XX XX XX XX XX XX XX XX XX XX XX XX XX XX XX XX XX XX XX XX XX XX XX XX XX XX XX XX XX XX XX XX XX XX XX XX XX XX XX XX XX XX XX XX XX XX XX XX XX XX XX XX XX XX XX XX XX XX XX XX XX XX XX XX XX XX XX XX XX XX XX XX XX XX XX XX XX XX XX XX XX XX XX XX XX XX XX XX XX XX XX XX 270 XX XX XX XX XX XX XX XX XX XX XX Source: Secondary Research, Expert Interviews, and TechSci Research Analysis 1. XXXXXXXXXXXXXXXXXXXXXXXXXXXXXXXXXXXXXXXXXXXXXXXXXXXXXXXXXXXXXX 2. XXXXXXXXXXXXXXXXXXXXXXXXXXXXXXXXXXXXXXXXXXXXXXXXXXXXXXXXXXXXXXXXXXXXXXXXXXXXXXXX 3. XXXXXXXXXXXXXXXXXXXXXXXXXXXXXXXXXXXXXXXXXXXXXXXXXXXXXXXXXXXXXXXXXXXXXXXXXXXXXXXXXXXXXXXXXXXXXXXXXXX 11 Note: These are dummy figures; please subscribe our report for actual data
India HDPE Trade Dynamics, 2013-2019 (Value in INR Million & Volume in 000’ Tonnes) Country 2013 2014 2015 2016 2017 2018 2019 (Till October 2018) Export Value XX XX XX XX XX XX XX XX XX XX XX XX Volume XX XX XX XX XX XX XX XX XX XX XX XX Value XX XX XX XX XX XX XX XX XX XX XX XX Volume XX XX XX XX XX XX XX XX XX XX XX XX Value XX XX XX XX XX XX XX XX XX XX XX XX Volume XX XX XX XX XX XX XX XX XX XX XX XX Value XX XX XX XX XX XX XX XX XX XX XX XX Volume XX XX XX XX XX XX XX XX XX XX XX XX Value XX XX XX XX XX XX XX XX XX XX XX XX Volume XX XX XX XX XX XX XX XX XX XX XX XX Value XX XX XX XX XX XX XX XX XX XX XX XX Volume XX XX XX XX XX XX XX XX XX XX XX XX Value XX XX XX XX XX XX XX XX XX XX XX XX Volume XX XX XX XX XX XX XX XX XX XX XX XX Bangladesh China Ethiopia Indonesia Kenya Nepal Pakistan Turkey United Arab Emirates Vietnam Others Total Source: Secondary Research and TechSci Research Analysis Others includes Ecuador, Malaysia, Sri Lanka, Tanzania, Qatar, Italy, Peru, Colombia, etc. Country 2013 2014 2015 2016 2017 2018 2019 (Till October 2018) Import Value XX XX XX XX XX XX XX XX XX XX XX XX Volume XX XX XX XX XX XX XX XX XX XX XX XX Value XX XX XX XX XX XX XX XX XX XX XX XX Volume XX XX XX XX XX XX XX XX XX XX XX XX Value XX XX XX XX XX XX XX XX XX XX XX XX Volume XX XX XX XX XX XX XX XX XX XX XX XX Value XX XX XX XX XX XX XX XX XX XX XX XX Volume XX XX XX XX XX XX XX XX XX XX XX XX Value XX XX XX XX XX XX XX XX XX XX XX XX Volume XX XX XX XX XX XX XX XX XX XX XX XX Value XX XX XX XX XX XX XX XX XX XX XX XX Volume XX XX XX XX XX XX XX XX XX XX XX XX Value XX XX XX XX XX XX XX XX XX XX XX XX Volume XX XX XX XX XX XX XX XX XX XX XX XX Iran South Korea Kuwait Qatar Saudi Arab Singapore Taiwan Thailand United Arab Emirates U S A Others Total Source: Secondary Research and TechSci Research Analysis Others includes Germany, Belgium,Spain, Taiwan, Netherland, Nigeria, Japan, Brazil, etc. 12 Note: These are dummy figures; please subscribe our report for actual data
HDPE DEMAND ANALYSIS
India HDPE Demand Market Share, By End Use, 2013-2030F (%) Containers Woven Sack & General Purpose Nets Packaging Films Pressure Pipes Consumer Goods Others 2030F 40.00% 25.00% 15.00% 12.00% 5.00% 3.00% 2029F 40.00% 25.00% 15.00% 12.00% 5.00% 3.00% 2028F 40.00% 25.00% 15.00% 12.00% 5.00% 3.00% 2027F 40.00% 25.00% 15.00% 12.00% 5.00% 3.00% 2026F 40.00% 25.00% 15.00% 12.00% 5.00% 3.00% 2025F 40.00% 25.00% 15.00% 12.00% 5.00% 3.00% 2024F 40.00% 25.00% 15.00% 12.00% 5.00% 3.00% 2023F 40.00% 25.00% 15.00% 12.00% 5.00% 3.00% 2022F 40.00% 25.00% 15.00% 12.00% 5.00% 3.00% 2021F 40.00% 25.00% 15.00% 12.00% 5.00% 3.00% 2020F 40.00% 25.00% 15.00% 12.00% 5.00% 3.00% 2019E 40.00% 25.00% 15.00% 12.00% 5.00% 3.00% 2018 40.00% 25.00% 15.00% 12.00% 5.00% 3.00% 2017 40.00% 25.00% 15.00% 12.00% 5.00% 3.00% 2016 40.00% 25.00% 15.00% 12.00% 5.00% 3.00% 2015 40.00% 25.00% 15.00% 12.00% 5.00% 3.00% 2014 40.00% 25.00% 15.00% 12.00% 5.00% 3.00% 2013 40.00% 25.00% 15.00% 12.00% 5.00% 3.00% Source: Secondary Research, Expert Interviews, and TechSci Research Analysis Others includes Automotive, building and construction, etc. 1. XXXXXXXXXXXXXXXXXXXXXXXXXXXXXXXXXXXXXXXXXXXXXXXXXXXXXXXXXXXXXX 2. XXXXXXXXXXXXXXXXXXXXXXXXXXXXXXXXXXXXXXXXXXXXXXXXXXXXXXXXXXXXXXXXXXXXXXXXXXXXXXXX 3. XXXXXXXXXXXXXXXXXXXXXXXXXXXXXXXXXXXXXXXXXXXXXXXXXXXXXXXXXXXXXXXXXXXXXXXXXXXXXXXXXXXXXXXXXXXXXXXXXXX 14 Note: These are dummy figures; please subscribe our report for actual data
India HDPE Demand Market Share, By End Use, 2013-2030F (%) Blow Molding Raffia HM/HDPE Film Pipe Injection Moulding Monofilament Others 2030F 40.00% 25.00% 15.00% 8.00% 5% 4% 3% 2029F 40.00% 25.00% 15.00% 8.00% 5% 4% 3% 2028F 40.00% 25.00% 15.00% 8.00% 5% 4% 3% 2027F 40.00% 25.00% 15.00% 8.00% 5% 4% 3% 2026F 40.00% 25.00% 15.00% 8.00% 5% 4% 3% 2025F 40.00% 25.00% 15.00% 8.00% 5% 4% 3% 2024F 40.00% 25.00% 15.00% 8.00% 5% 4% 3% 2023F 40.00% 25.00% 15.00% 8.00% 5% 4% 3% 2022F 40.00% 25.00% 15.00% 8.00% 5% 4% 3% 2021F 40.00% 25.00% 15.00% 8.00% 5% 4% 3% 2020F 40.00% 25.00% 15.00% 8.00% 5% 4% 3% 2019E 40.00% 25.00% 15.00% 8.00% 5% 4% 3% 2018 40.00% 25.00% 15.00% 8.00% 5% 4% 3% 2017 40.00% 25.00% 15.00% 8.00% 5% 4% 3% 2016 40.00% 25.00% 15.00% 8.00% 5% 4% 3% 2015 40.00% 25.00% 15.00% 8.00% 5% 4% 3% 2014 40.00% 25.00% 15.00% 8.00% 5% 4% 3% 2013 40.00% 25.00% 15.00% 8.00% 5% 4% 3% Source: Secondary Research, Expert Interviews, and TechSci Research Analysis Others includes Sheets, playboard, shield, etc. 1. XXXXXXXXXXXXXXXXXXXXXXXXXXXXXXXXXXXXXXXXXXXXXXXXXXXXXXXXXXXXXX 2. XXXXXXXXXXXXXXXXXXXXXXXXXXXXXXXXXXXXXXXXXXXXXXXXXXXXXXXXXXXXXXXXXXXXXXXXXXXXXXXX 3. XXXXXXXXXXXXXXXXXXXXXXXXXXXXXXXXXXXXXXXXXXXXXXXXXXXXXXXXXXXXXXXXXXXXXXXXXXXXXXXXXXXXXXXXXXXXXXXXXXX 15 Note: These are dummy figures; please subscribe our report for actual data
India HDPE Demand Market Share, By Sales Channel, 2013-2030F (%) Direct Company Sale Direct Import Distributors Retailers 2019E 24.84% 13.40% 60.83% 0.93% 2018 23.22% 20.31% 54.20% 2.27% 2017 21.26% 26.21% 49.60% 2.93% 2016 18.31% 35.05% 42.73% 3.91% 2015 17.14% 38.55% 40.01% 4.30% 2014 18.23% 35.30% 42.54% 3.93% 2013 17.54% 37.37% 40.93% 4.16% Source: Secondary Research, Expert Interviews, and TechSci Research Analysis 1. XXXXXXXXXXXXXXXXXXXXXXXXXXXXXXXXXXXXXXXXXXXXXXXXXXXXXXXXXXXXXX 2. XXXXXXXXXXXXXXXXXXXXXXXXXXXXXXXXXXXXXXXXXXXXXXXXXXXXXXXXXXXXXXXXXXXXXXXXXXXXXXXX 3. XXXXXXXXXXXXXXXXXXXXXXXXXXXXXXXXXXXXXXXXXXXXXXXXXXXXXXXXXXXXXXXXXXXXXXXXXXXXXXXXXXXXXXXXXXXXXXXXXXX 16 Note: These are dummy figures; please subscribe our report for actual data
India HDPE Demand Market Share, By Region, 2013-2030F (%) South North 25.50% 2030F 20.00% 2030F 25.95% 2018 23.63% 2018 East West 14.29% 2030F 40.21% 2030F 40.01% 2018 10.41% 2018 Source: Secondary Research, Expert Interviews, and TechSci Research Analysis 1. XXXXXXXXXXXXXXXXXXXXXXXXXXXXXXXXXXXXXXXXXXXXXXXXXXXXXXXXXXXXXX 2. XXXXXXXXXXXXXXXXXXXXXXXXXXXXXXXXXXXXXXXXXXXXXXXXXXXXXXXXXXXXXXXXXXXXXXXXXXXXXXXX 3. XXXXXXXXXXXXXXXXXXXXXXXXXXXXXXXXXXXXXXXXXXXXXXXXXXXXXXXXXXXXXXXXXXXXXXXXXXXXXXXXXXXXXXXXXXXXXXXXXXX 17 Note: These are dummy figures; please subscribe our report for actual data
India HDPE Demand Market Share, By Company, 2019E (%) 10.05% 100.00% 30.00% 17.30% 14.20% 10.75% 8.23% 5.37% 2.08% 2.02% Total Reliance Industries Limited GAIL (India) Limited ONGC Petro additions Limited Indian Oil Corporation Limited Haldia Brahmaputra Cracker and Polymers Limited Saudi Arabian Basic Industries Corporation Qatar Others Petrochemicals Limited Petrochemical Company Source: Secondary Research, Expert Interviews, and TechSci Research Analysis Others includes Hanwha, LG Polymers, Borealis, Exxon Mobil 1. XXXXXXXXXXXXXXXXXXXXXXXXXXXXXXXXXXXXXXXXXXXXXXXXXXXXXXXXXXXXXX 2. XXXXXXXXXXXXXXXXXXXXXXXXXXXXXXXXXXXXXXXXXXXXXXXXXXXXXXXXXXXXXXXXXXXXXXXXXXXXXXXX 3. XXXXXXXXXXXXXXXXXXXXXXXXXXXXXXXXXXXXXXXXXXXXXXXXXXXXXXXXXXXXXXXXXXXXXXXXXXXXXXXXXXXXXXXXXXXXXXXXXXX 18 Note: These are dummy figures; please subscribe our report for actual data
HDPE CUSTOMER ANALYSIS
Partial List of Major HDPE Customers in India Company Name Location Product Applications Average Monthly Consumption (Tonnes) Sintex Industries Limited Ahmedabad Rotomoulding 1,800 Supreme Industries Mumbai, Maharashtra Pipes and Fittings, IM 600 XX XX XX XX XX XX XX XX XX XX XX XX XX XX XX XX XX XX XX XX XX XX XX XX XX XX XX XX XX XX XX XX XX XX XX XX XX XX XX XX XX XX XX XX XX XX XX XX XX XX XX XX XX XX XX XX Source: Secondary Research, Expert Interviews, and TechSci Research Analysis 20 Note: These are dummy figures; please subscribe our report for actual data
All India Average Basic Price for HDPE, December 2018 (INR/Tonne) All India Average Basic Price December 2018 (INR/tonne) Products Application Major Grade/Brand HDPE Blow Molding - Non Beverage Bottle (HIC) 52GB001, 52GB010, 52GB003, 52GB002 1678 HDPE HMW Film 50GF003, 50GF004 1640 HDPE Injection Molding M60200, M60075, L60075 1631 HDPE Bimodal Pressure Pipe 46GP009 1720 HDPE Bimodal Non-Pressure Pipe E 41003 1679 HDPE Blow Molding - Non Beverage Bottle (HIC) 52GB001, 52GB010, 52GB003, 52GB002 1678 HDPE HMW Film 50GF003, 50GF004 1640 Source: Secondary Research, Expert Interviews, and TechSci Research Analysis 22 Note: These are dummy figures; please subscribe our report for actual data
India HDPE Daily Prices, 01/01/2019-31/01/2019 (INR/Tonne) Pipe Raffia Microfilament Film Roto 82590 82590 82590 82590 82590 82590 82590 82089 82089 82089 82089 82089 82089 82089 82089 82089 82089 82089 82089 82089 82089 82089 82089 82089 89840 89840 89840 89840 89840 89840 89840 89338 89338 89338 89338 89338 89338 89338 89338 89338 89338 89338 89338 89338 89338 89338 89338 89338 88330 88330 88330 88330 88330 88330 88330 87828 87828 87828 87828 87828 87828 87828 87828 87828 87828 87828 87828 87828 87828 87828 87828 87828 86660 86660 86660 86660 86660 86660 86660 86158 86158 86158 86158 86158 86158 86158 86158 86158 86158 86158 86158 86158 86158 86158 86158 86158 82375 82375 82375 82375 82375 82375 82375 81868 81868 81868 81868 81868 81868 81868 81868 81868 81868 81868 81868 81868 81868 81868 81868 81868 Source: Expert Interviews, and TechSci Research Analysis 23 Note: These are dummy figures; please subscribe our report for actual data
India HDPE Monthly Prices, July 2018-Feburary2019 (INR/Tonne) Pipe Raffia Microfilament Film Roto 91589 90089 89498 89498 86998 82089 82089 80379 98838 97338 96748 95748 95748 89338 89338 89338 97328 95828 95238 94238 94238 87828 87828 87828 95658 94158 93568 92568 92568 86158 86158 86158 91378 89878 89288 89288 86788 81868 81878 80378 July, 2018 August, 2018 September, 2018 October, 2018 November, 2018 December, 2018 January, 2019 Feburary, 2019 Source: Expert Interviews, and TechSci Research Analysis 24 Note: These are dummy figures; please subscribe our report for actual data
India HDPE Quarterly Prices, Q4 2018-Q4 2019 (INR/Tonne) Pipe Raffia Microfilament Film Roto 88665 87922 87889 84737 81234 96081 95171 93285 87593 89338 94571 93661 91782 87437 87828 92901 91991 90595 85883 86158 88455 87711 87482 83937 81123 Q4, 2018 Q1, 2019 Q2, 2019 Q3, 2018 Q4, 2019 Source: Expert Interviews, and TechSci Research Analysis 25 Note: These are dummy figures; please subscribe our report for actual data
India HDPE Yearly Prices, 2013-2030F (INR/Tonne) Pipe Raffia Microfilament Film Roto 124077 108216 124991 100184 89609 88898 88192 87492 86798 86109 85426 89877 87303 110678 84748 87668 84075 83408 82746 82089 100815 104101 102663 101246 130021 99848 98470 97110 95769 94447 93033 90244 93143 89329 91857 90589 89338 116308 103293 101017 99740 98480 97235 96006 94793 93595 91546 91863 92412 91078 91244 90091 88952 87828 128173 112087 102929 97706 96595 95497 94411 93338 92276 90034 91227 90343 90190 88650 89165 88151 87149 86158 125901 109244 100814 91338 90433 89538 88651 88253 87774 86896 86905 86745 86044 85192 84349 83514 82687 81868 2013 2014 2015 2016 2017 2018 2019E 2020F 2021F 2022F 2023F 2024F 2025F 2026F 2027F 2028F 2029F 2030F Source: Expert Interviews, and TechSci Research Analysis 1. XXXXXXXXXXXXXXXXXXXXXXXXXXXXXXXXXXXXXXXXXXXXXXXXXXXXXXXXXXXXXX 2. XXXXXXXXXXXXXXXXXXXXXXXXXXXXXXXXXXXXXXXXXXXXXXXXXXXXXXXXXXXXXXXXXXXXXXXXXXXXXXXX 3. XXXXXXXXXXXXXXXXXXXXXXXXXXXXXXXXXXXXXXXXXXXXXXXXXXXXXXXXXXXXXXXXXXXXXXXXXXXXXXXXXXXXXXXXXXXXXXXXXXX 26 Note: These are dummy figures; please subscribe our report for actual data
India HDPE RECENT NEWS 1 2 10thJanuary 2019: Dip in HDPE price in South Asia 21stAugust 2018: Jamnagar PE facility scheduled to restart by 22nd August In India, HDPE yarn rates were at the INR 73258.6 per MT, while in HDPE BM costs were evaluated at the INR 72911.4 per MT, both fell at INR 694.4 per MT on the week. HDPE film costs were valued at the INR 72911.4 per MT and HDPE injection costs were at the INR 70828.2 per MT, a week on week drop of INR 347.2 per MT and INR 2083.2 per MT respectivelyfrom the earlierweek. XXXXXXXXXXXXXXXXXXXXXXXXXXXXXXXXXXXXXXXXXXXXXXXXXXXXXX XXXXXXXXXXXXXXXXXXXXXXXXXXXXXXXXXXXXXXXXXXXXXXXXXXXXXXXXXXXXXXXXXXXXX 3 4 XXXXXXXXXXXXXXXXXXXXXXXXXXXXXXXXXXXXXXXXXXXXXXXXXXXXXX XXXXXXXXXXXXXXXXXXXXXXXXXXXXXXXXXXXXXXXXXXXXXXXXXXXXX XXXXXXXXXXXXXXXXXXXXXXXXXXXXXXXXXXXXXXXXXXXXXXXXXXXXXX XXXXXXXXXXXXXXXXXXXXXXXXXXXXXXXXXXXXXXXXXXXXXXXXXXXXXXXXXXXXXXXXXXXXX XXXXXXXXXXXXXXXXXXXXXXXXXXXXXXXXXXXXXXXXXXXXXXXXXXXXXX XXXXXXXXXXXXXXXXXXXXXXXXXXXXXXXXXXXXXXXXXXXXXXXXXXXXXXXXXXXXXXXXXXXXX Source: Secondary Research 28
COMPETITIVE INTELLIGENCE
Competitor Profile Reliance Industries Limited Financials (INR Millions) Basic Details Particulars 2017 2018 Name of the Company Reliance Industries Limited Revenues 2737500 3135550 Registration Date 08-05-1973 CIN L17110MH1973PLC019786 % Growth 5.67% 14.54% PBT 435000 503810 Category/Sub-category of the Company Company Limited by Shares / Private Company % margin 15.89% 16.07% Address of the Registered Office 3rd Floor, 222 Maker Chambers IV, Nariman Point, Mumbai – 400021 PAT 314250 336120 % margin 11.48% 10.72% Website: www.ril.com; Email Id: info@ril.com; Phone No. : +91-22-22785000 Contact details Reliance Major Products & Segmental Revenue Information, 2018 Number of Employee (FY2018) 1,87,729 Managing Director/CEO Mukesh D. Ambani (CEO) 26.59% Refining Expansion Plans Petrochemicals Oil & Gas Exploration 2018 1.19% 2.15% March 2017: Reliance Industries Limited is setting up new PE production capacities at Jamnagar, Gujarat, which will comprise a HDPE/HDPE swing plant. Others 70.07% Source: Secondary Research, Expert Interviews, and TechSci Research Analysis Petrochemicals includes Polypropylene, HDPE, HDPE, Purified Terephthalic Acid, Paraxylene, Ethylene Glycol, etc. Others include Polyester Yarn, Polyester Fiber, Organized Retail, Digital Services etc. 30 Note: These are dummy figures; please subscribe our report for actual data
Competitor Profile Reliance Industries Limited •XXXXXXXXXXXXXXXXXXXXXXXXXXXXXXXXXXX XX •XXXXXXXXXXXXXXXXXXXXXXXXXXXXXXXXXXX XX Strong brand image and leading market player in petrochemicals Healthy operational efficiency in refining Strong distribution network • Market Segment Spread •XXXXXXXXXXXXXXXXXXXXXXXXXXXXXXXXXXXXX • • KEY STRATEGIES S W Long Term Sustainable Growth •XXXXXXXXXXXXXXXXXXXXXXXXXXXXXXXXXXXXX STRENGTHS WEAKNESSES OPPORTUNITIES THREATS Target Highly Volatile Market •RIL is looking to target volatile market through international off-takers/traders. O T Intense domestic competition Increasing petrochemical supply from MEA countries Vulnerable to rupees exchange rate • • Increasing Profit •XXXXXXXXXXXXXXXXXXXXXXXXXXXXXXXXXXX XX •XXXXXXXXXXXXXXXXXXXXXXXXXXXXXXXXXXXXX • 31 Note: These are dummy figures; please subscribe our report for actual data
Competitor Profile Reliance Industries Limited Manufacturing Locations Gujarat Hazira Line 1: 200 KTPA Hazira Line 2: 250 KTPA XXXXXXXXXXXXXXXXX XXXXXXXXXXXXXXXXX XXXXXXXXXXXXXXXXX 32 Note: These are dummy figures; please subscribe our report for actual data
About Us & Disclaimer CHEMANALYST.COM is a one stop comprehensive digital platform for the market intelligence report on chemical & petrochemical industry. Our aim is to provide competitive advantage to industry stakeholders by offering valuable information and analysis that help our customer to create a great opportunity for their business. ChemAnalyst’ team of 100+ analyst is engaged in tracking capacity (by company, by location, by technology, by process), production, demand (by end use, by type, by sales channel, by region), demand-supply scenario (total demand, inventory, demand-supply gap), plant operation, foreign trade (top ten countries), major customers and news/deals. ChemAnalyst brings you real time daily/ monthly/ quarterly/ yearly prices of major chemicals & petrochemicals that gives you a competitive advantage in price negotiations with suppliers and traders. We are committed to deliver quality in whatever we do. Partial List of Clients Related Reports India LLDPE Comprehensive Techno-Commercial Market Analysis, 2030 India Polycarbonate Comprehensive Techno-Commercial Market Analysis, 2030 India SAN Comprehensive Techno-Commercial Market Analysis, 2030 India ABS Comprehensive Techno-Commercial Market Analysis, 2030 India PET Comprehensive Techno-Commercial Market Analysis, 2030 India PVC Comprehensive Techno-Commercial Market Analysis, 2030 India PBT Comprehensive Techno-Commercial Market Analysis, 2030 India MEG Comprehensive Techno-Commercial Market Analysis, 2030 India PTA Comprehensive Techno-Commercial Market Analysis, 2030 ChemAnalyst – Europe 54, Old brook, Bretton, Peterborough, United Kingdom Email: sales@chemanalyst.com www.chemanalyst.com ChemAnalyst – Asia-Pacific B – 44, Sector – 57, Noida, National Capital Region, U.P. - India Tel: +91-120-4523900 Email: sales@chemanalyst.com www.chemanalyst.com ChemAnalyst– North America 708 Third Avenue, Manhattan, New York, United States Tel: +1- 646- 360- 1656 Email: sales@chemanalyst.com www.chemanalyst.com Disclaimer The contents of this report are based on information generally available to the public from sources believed to be reliable. No representation is made that it is timely, accurate or complete. TechSci Research has taken due care and caution in compilation of data as this has been obtained from various sources includingwhich it considers reliable and first hand. However, TechSci Research does not guarantee the accuracy, adequacy or completeness of any information and it is not responsible for any errors or omissions or for the results obtained from the use of such information and especially states that ithas no financial liability whatsoever to the subscribers / users of this report.The information herein, together with all estimates and forecasts, can change without notice. All the figures provided in this document are indicative of relative market size and are strictly for client’s internal consumption. Usage of thesame forpurposeotherthan internal will requirepriorapproval of TechSciResearch.