Download
1 / 3
0 likes | 3 Views
In this exploration, we delve into three crucial aspects of mathematics: place value, function graphs, and table of chi square distribution. Each plays a unique role in mathematical understanding, from foundational principles to statistical analysis.

E N D
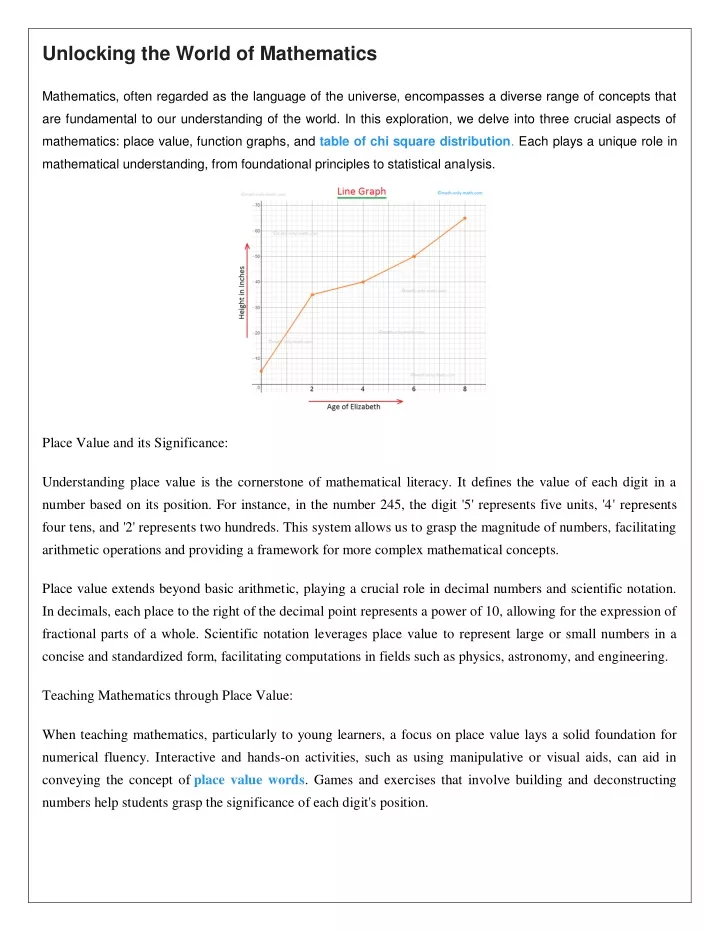
Unlocking the World of Mathematics Mathematics, often regarded as the language of the universe, encompasses a diverse range of concepts that are fundamental to our understanding of the world. In this exploration, we delve into three crucial aspects of mathematics: place value, function graphs, and table of chi square distribution. Each plays a unique role in mathematical understanding, from foundational principles to statistical analysis. Place Value and its Significance: Understanding place value is the cornerstone of mathematical literacy. It defines the value of each digit in a number based on its position. For instance, in the number 245, the digit '5' represents five units, '4' represents four tens, and '2' represents two hundreds. This system allows us to grasp the magnitude of numbers, facilitating arithmetic operations and providing a framework for more complex mathematical concepts. Place value extends beyond basic arithmetic, playing a crucial role in decimal numbers and scientific notation. In decimals, each place to the right of the decimal point represents a power of 10, allowing for the expression of fractional parts of a whole. Scientific notation leverages place value to represent large or small numbers in a concise and standardized form, facilitating computations in fields such as physics, astronomy, and engineering. Teaching Mathematics through Place Value: When teaching mathematics, particularly to young learners, a focus on place value lays a solid foundation for numerical fluency. Interactive and hands-on activities, such as using manipulative or visual aids, can aid in conveying the concept of place value words. Games and exercises that involve building and deconstructing numbers help students grasp the significance of each digit's position.
Real-world examples, like currency values or measurements, provide context for understanding place value in practical scenarios. By employing a variety of teaching methods, educators can ensure that students develop a deep and intuitive understanding of the fundamental concept of place value. Function Graphs: Visualizing Mathematical Relationships: Graphs are powerful tools for representing mathematical relationships, and function graphs, in particular, provide a visual representation of how one variable depends on another. In a function graph, the x-axis typically represents the independent variable, while the y-axis represents the dependent variable. As the independent variable changes, the corresponding values on the y-axis are determined by the function. Understanding function graphs is essential for interpreting real-world phenomena, from the motion of objects to economic trends. Linear functions, represented by straight lines, signify a constant rate of change, while quadratic functions, represented by curves, capture more complex relationships. Exponential and logarithmic functions showcase rapid growth or decay, respectively. Teaching Mathematics through Function Graphs: Introducing function graphs in the classroom involves demonstrating the relationship between variables in different contexts. Hands-on activities, interactive simulations, and real-world examples help students visualize the connections between quantities. Graphing calculators and software further enhance the learning experience by allowing students to experiment with various functions and observe the resulting graphs. Engaging students in creating their own graphs based on data they collect fosters a deeper understanding of the relationship between variables. Encouraging discussions about the significance of slope, intercepts, and shape in different types of graphs enhances analytical skills and critical thinking. By incorporating technology and collaborative learning, educators can make the study of graphs that represent functions both accessible and engaging. The Chi-Square Distribution Table: Statistical Analysis Made Accessible: In the realm of statistical analysis, the chi-square distribution table serves as a valuable tool for hypothesis testing and assessing the significance of observed versus expected data. The chi-square test is particularly useful when analyzing categorical data and determining if observed frequencies differ significantly from expected frequencies. The chi-square distribution table provides critical values for different degrees of freedom and significance levels, enabling statisticians to make informed decisions about the validity of their findings. By comparing
calculated chi-square values to the table's critical values, researchers can determine whether the observed data deviates significantly from what would be expected by chance. Original source: https://teachyoumathss.blogspot.com/2023/11/unlocking-world-of-mathematics.html