Download
1 / 8
80 likes | 150 Views
Trace elements composition of Guava, Lemon, Moringa, Okra, Pepper, Roselle, Spinach and Tomato from ten<br>irrigation areas (viz Magaga, Thomas Dam, Wasai, Garin-dau, Danguguwa, Watari, Marke, Joda, `Yarrutu and<br>Guzu-guzu) of Kano State were investigated. The results obtained showed that the mean [Cd] is 0.27 ± 0.06mg/dm3<br>,<br>[Zn] 2.39 ± 0.11mg/dm3 , [Ca] 4.05 ± 0.20mg/dm3<br>, [Mn] 0.31 ± 0.02mg/dm3 , [Co] 1.38 ± 0.10mg/dm3<br>, [Ni] 1.75 ± 0.13mg/dm3 , [Cr] 4.48 ± 0.20mg/dm3<br>, [Pb] 1.05 ± 0.13mg/dm3 , [Cu] 1.98 ± 0.15mg/dm3<br> and [Fe] 0.32 ± 0.18mg/dm3 . The mean concentrations of Mn, Cd, Zn, Fe, Cu and Ca were within the tolerable limits of 0.5mg/dm3 <br>0.8mg/dm3 , 5.0mg/dm3<br>, 0.30mg/dm3<br>, 2.00mg/dm3<br> and 7.5mg/dm3 respectively while the mean concentrations of Ni, Co, Pb and Cr were above the permissible limits of 0.02mg/dm3 , 0.25mg/dm3 , 0.05mg/dm3 and 0.05mg/dm3<br>respectively set by United states environmental protection agency(USEPA). The moisture contents of all the samples<br>were analysed, having Tomato with the highest mean moisture content of 91.29% and Pepper with lowest value of<br>67.69%. <br>

E N D
Available online www.jocpr.com Journal of Chemical and Pharmaceutical Research, 2013, 5(5):159-166 ISSN : 0975-7384 CODEN(USA) : JCPRC5 Research Article Spectrophotometric determination of trace elements in some fruits and vegetables M I Mohammed, R A Musa and A A Salisu* Department of Pure and Industrial Chemistry, Bayero University Kano, Kano, Nigeria _____________________________________________________________________________________________ ABSTRACT TraceelementscompositionofGuava, Lemon, Moringa, Okra, Pepper, Roselle, Spinachand Tomatofromten irrigationareas(vizMagaga, ThomasDam, Wasai, Garin-dau, Danguguwa, Watari, Marke, Joda, `Yarrutuand Guzu-guzu)ofKanoStatewereinvestigated. Theresultsobtainedshowedthatthe mean [Cd] is 0.27 ± 0.06mg/dm3, [Zn] 2.39 ± 0.11mg/dm3, [Ca] 4.05 ± 0.20mg/dm3, [Mn] 0.31 ± 0.02mg/dm3, [Co] 1.38 ± 0.10mg/dm3, [Ni] 1.75 ± 0.13mg/dm3, [Cr] 4.48 ± 0.20mg/dm3, [Pb] 1.05 ± 0.13mg/dm3, [Cu] 1.98 ± 0.15mg/dm3 and [Fe] 0.32 ± 0.18mg/dm3. The mean concentrations of Mn, Cd, Zn, Fe, Cu and Ca were within the tolerable limits of 0.5mg/dm3, 0.8mg/dm3, 5.0mg/dm3, 0.30mg/dm3, 2.00mg/dm3 and 7.5mg/dm3respectively while the mean concentrations of Ni, Co, Pb and Cr were above the permissible limits of 0.02mg/dm3, 0.25mg/dm3, 0.05mg/dm3 and 0.05mg/dm3 respectively set by United states environmental protection agency(USEPA).Themoisturecontentsofallthesamples wereanalysed, havingTomatowiththehighestmeanmoisturecontentof91.29%andPepperwithlowestvalueof 67.69%. Keywords: Fruit, Kano, Trace elements, Vegetable _____________________________________________________________________________________________ INTRODUCTION The widespread concentration of various elements in the air, water and land may be increased beyond their natural levels due to agricultural, domestic and industrial effluents [15]. Heavy metals enter the human body through inhalation and ingestion, the latter being the main route of exposure to these elements in human population. Vegetables constitute essential diet components by contributing proteins, vitamins, iron, calcium and other nutrients which are usually in short supply [19]. They also contain both essential and toxic elements over a wide range of concentrations. Metals in vegetables may pose a direct threat to human health. Vegetables take up elements by absorbing them from contaminated soils and waste water used for irrigating the vegetables as well as from deposits on different parts of the vegetables exposed to the air from polluted environment [8]. Regular high consumption of fruits and vegetables is recommended as part of healthy eating. Epidermiological studies have shown that high intake of lycopene-containing vegetables is inversely associated with the incidence of certain type of cancer, for example habitual intake of tomato products has been inversely associated with the risk of cancer of the digestive tract among Italians [14].The aim of this research is to asses and compare the metal content of some fruits and vegetables that are irrigated within some localities in Kano State. This analysis will reveal the metal content of these fruits and vegetables and as such, their consumers will either be encouraged or discouraged from consuming them. Researchers working in the related field will be informed so as to further exploit them to solve the nutritional and health problems of the populace. 159
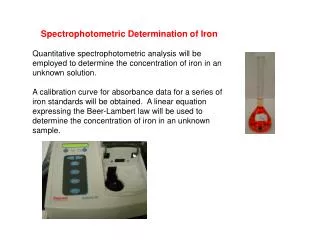
A A Salisu et al ______________________________________________________________________________ J. Chem. Pharm. Res., 2013, 5(5):159-166 EXPERIMENTAL SECTION In the preparation of reagents, chemicals of analytical grade purity and distilled water were used. All glass wares were washed with detergent and rinsed with water before drying in the oven at 1050C, for 2 hours. Sample Collection and Preparation Eighty samples of fruits and vegetables(viz: Guava, Lemon, Moringa, Okra, Pepper, Roselle, Spinach and Tomato) collected from ten different irrigation areas of Kano State (viz: Magaga, Thomas Dam, Wasai, Garin-dau, Danguguwa, Watari, Marke, Joda, `Yarrutu and Guzu-guzu) were investigated. All the samples were washed with water to remove any adhered materials and soil and stored in polythene bags for analysis. The fruit and vegetable samples were cut into small pieces, dried at 1050C for 2 hours in an oven and were pounded in a mortar and pestle until a powder was produced which was stored in air-tight plastic container before analysis. All samples were analyzed in triplicate and mean values reported. Procedure 1.0g portion of each of the ground fruit and vegetable samples were weighed into a 250cm3 beaker and 10cm3 of a mixture of HNO3 and HCl (1:3) was added. The mixture was digested on a hot plate until a clear solution was obtained, the beaker was cooled and the content was diluted with 20cm3 distilled water, filtered and made up to 50cm3 mark in a volumetric flask [8]. Blank experiments were carried out involving all the reagents. The solutions were analysed for cadmium, calcium, cobalt, manganese, lead, nickel, iron, zinc, chromium and copper using ALPHA 4 model, Atomic Absorption Spectrophotometer (AAS). A calibration plot of absorbance against concentrations of each element under investigation was constructed and finally the concentration of each element was determined from the calibration curve of its standards by extrapolation. RESULTS AND DISCUSSION Moisture contents The result obtained showed that water is the major constituent in fruits and vegetables sometimes constituting up to 95% of the total weight. The reason for this high moisture content is that water is the most essential path for the transport of materials [13]. It is also the essential constituent of the protoplasm and it is the major site in which chemical reaction takes place [13]. The variation of the moisture content in the different samples can be explained as the result of fluctuations of soil moisture content and humidity of the air [13]. The highest mean moisture content of 91.29% was found in tomato and the least 67.69% was in pepper (Fig.1). High moisture content aids microbial activities and fruits and vegetables with least moisture content are easier to preserve [13]. 100 Mean (%) moisture content 90 80 70 60 50 40 30 20 10 0 GUA LEM MRG OKR PEP ROS SPN TMT Fruit and Vegetable Samples Fig. 1 Mean percent (%) moisture content of the samples analysed. 160
A A Salisu et al ______________________________________________________________________________ J. Chem. Pharm. Res., 2013, 5(5):159-166 Cadmium (Cd) The frequency distribution pattern for cadmium in the samples analysed is shown in Fig. 2. This shows the scenario of the metal in the area with mean concentration and standard deviation of 0.27 ± 0.06mg/dm3. The mean concentration observed in all the samples analysed is below the maximum permissible limit of 0.8mg/dm3 [3] 0.6 Mean conc. of Cd (mg/dm ) 0.5 0.4 0.3 0.2 0.1 0 GUA LEM MRG OKR PEP ROS SPN TMT Fruit and Vegetable Samples Fig. 2 Mean concentrations of cadmium (mg/dm3) in the samples analysed. GUA = Guava, LEM = Lemon, MRG = Moringa, OKR = Okra, PEP = Pepper, ROS = Roselle, SPN = Spinach, TMT = Tomato High intake can lead to accumulation and resulting in kidney damage [11]. Calcium (Ca) The frequency distribution pattern for calcium in the samples analysed is as shown in Fig. 3. This shows the scenario of the metal in the area, with mean concentration and standard deviation of 4.05 ± 0.20mg/dm3. Calcium is not known to be extremely toxic because it is an essential element to plant and is associated with growth and maintenance of bones, teeth, muscles and reduction of blood cholesterol level [11]. Cobalt (Co) The frequency distribution pattern for cobalt in the samples analysed is as shown in Fig. 4 This shows the scenario of the metal in the area, with mean concentration and standard deviation of 1.38 ± 0.10mg/dm3. Its wide distribution could be natural or due to environmental activities. The likely sources of cobalt are from dyes, pigments, preservatives, tanning agents and the burning of fossil fuel [21] 6 Mean conc. of Ca (mg/dm ) 5 4 3 2 1 0 GUA LEM MRG OKR PEP ROS SPN TMT Fruit and Vegetable Samples Fig. 3 Mean concentrations of calcium (mg/dm3) in the samples analysed. 161
A A Salisu et al ______________________________________________________________________________ J. Chem. Pharm. Res., 2013, 5(5):159-166 1.8 Mean conc. of Co (mg/dm ) 1.6 1.4 1.2 1 0.8 0.6 0.4 0.2 0 GUA LEM MRG OKR PEP ROS SPN TMT Fruit and Vegetable Samples Fig. 4 Mean concentrations of cobalt (mg/dm3) in the samples analysed. 6 Mean conc. of Cr (mg/dm ) 5 4 3 2 1 0 GUA LEM MRG OKR PEP ROS SPN TMT Fruit and Vegetable Samples Fig. 5 Mean concentrations of chromium (mg/dm3) in the samples analysed. Chromium (Cr) The frequency distribution pattern for chromium in the samples analysed is as shown in Fig. 5. This shows the scenario of the metal in the area, with mean concentration and standard deviation of 4.48 ± 0.20mg/dm3. Its high concentration could be attributed to increased tannery processes in the area. This is in line with [2] findings, that chromium and its salts used in industries have affected water quality. The occurence of chromium in soil is often the result of human activities, also noted that the use ofchromium salts in the manufacture of catalysis, ceramics and chromium metal production has aided the distribution of chromium [23]. Manganese (Mn) The frequency distribution pattern for manganese in the samples analysed is shown in Fig. 6. The mean concentration and standard deviation of the metal is 0.31 ± 0.02mg/dm3. This may be attributed to the fact that manganese occurs together with iron naturally, this is in line with WHO [24] report. The observed distribution pattern in all these areas may be due to the geological formation of the area. The maximum permissible limit of manganese is 0.5mg/dm3 [24]. Its ability to adsorb onto soil to an extent depending on the organic content of the soil as stated by United State Department of Health and Human Services [2] may also be considered. Nickel (Ni) The frequency distribution pattern for nickel in the samples analysed is shown in Fig. 7. The mean concentration and standard deviation of the metal is 1.75 ± 0.13 mg/dm3. This observed distribution pattern may be due to pollution from natural or environmental activities, and this is in agreement with [2] report. The observed distribution pattern in all these areas may be due to oxidation of natural nickel-containing ferrosulphide deposit or environmental activies in the area as noted by [2] and [5]. Lead (Pb) The frequency distribution pattern for lead in the samples analysed is shown in Fig. 8. The mean concentration and standard deviation of the metal is 1.05 ± 0.13mg/dm3. This may be due to the presence of highest concentration of lead which usually occurs in surface soil at depths of 1-5cm, this is in line with [2]. The observed distribution pattern in all these areas may be due to wide distribution of lead in the earth`s crust; its frequent use in lead acid batteries, solder, rust inhibitors and plastic stabilizers [4]. 162
A A Salisu et al ______________________________________________________________________________ J. Chem. Pharm. Res., 2013, 5(5):159-166 0.5 Mean conc. of Mn (mg/dm ) 0.45 0.4 0.35 0.3 0.25 0.2 0.15 0.1 0.05 0 GUA LEM MRG OKR PEP ROS SPN TMT Fruit and Vegetable Samples Fig. 6 Mean concntrations of manganese (mg/dm3) in the samples analysed. Mean conc. of Ni (mg/dm ) 2.5 2 1.5 1 0.5 0 GUA LEM MRG OKR PEP ROS SPN TMT Fruit and Vegetable Samples Fig. 7 Mean concentrations of nickel (mg/dm3) in the samples analysed. GUA = Guava, LEM = Lemon, MRG = Moringa, OKR = Okra, PEP = Pepper, ROS = Roselle, SPN = Spinach, TMT = Tomato Iron (Fe) The frequency distribution pattern for iron in the samples analysed is shown in Fig. 9. This shows the scenario of the metal in the area with mean concentration and standard deviation of 0.32.± 0.18mg/dm3. This may be due to its wide distribution in the earth`s crust. It is the second most abundant metal in the earth`s crust of which it accounts for about 5% as recorded by [12] and [7]. The mean iron concerntration observed in all the samples analysed may be due to its great abundance in the earth`s crust. Zinc (Zn) The frequency distribution pattern for zinc in the samples analysed is shown in Fig. 10. This shows the scenario of the metal in the areas with mean concentration and standard deviation of 2.39 ± 0.11mg/dm3. Zinc is an essential element in all living organisms and many enzymes including aldolases, pepsidases and others contain zinc [2]. 163
A A Salisu et al ______________________________________________________________________________ J. Chem. Pharm. Res., 2013, 5(5):159-166 1.6 Mean conc. of Pb (mg/dm ) 1.4 1.2 1 0.8 0.6 0.4 0.2 0 GUA LEM MRG OKR PEP ROS SPN TMT Fruit and Vegetable Samples Fig. 8 Mean concentrations of lead (mg/dm3) in the samples analysed. 0.45 Mean conc. of Fe (mg/dm ) 0.4 0.35 0.3 0.25 0.2 0.15 0.1 0.05 0 GUA LEM MRG OKR PEP ROS SPN TMT Fruit and Vegetable Samples Fig. 9 Mean concentrations of iron (mg/dm3) in the samples analysed. 3 Mean conc. of Zn (mg/dm ) 2.5 2 1.5 1 0.5 0 GUA LEM MRG OKR PEP ROS SPN TMT Fruit and Vegetable Samples Fig. 10 Mean concentrations of zinc (mg/dm3) in the samples analysed. GUA = Guava, LEM = Lemon, MRG = Moringa, OKR = Okra, PEP = Pepper, ROS = Roselle, SPN = Spinach, TMT = Tomato This shows zinc concentration falls below the maximun permissible limit of 5mg/dm3 set by WHO [25]. Copper (Cu) The frequency distribution pattern for copper in the samples analysed is as shown in Fig. 11. This shows the scenario of the metal in the areas with mean concentration and standard deviation of 1.98 ± 0.15mg/dm3. The high concentration could be due to wide application of copper as it is used in pest control, as organic dyes, as feed additives, in seed dissinfectants, as fungicides and algicides [22]. 164
A A Salisu et al ______________________________________________________________________________ J. Chem. Pharm. Res., 2013, 5(5):159-166 2.5 Mean conc. of Cu (mg/dm ) 2 1.5 1 0.5 0 GUA LEM MRG OKR PEP ROS SPN TMT Fruit and Vegetable Samples Fig. 11 Mean concentrations of copper (mg/dm3) in the samples analysed. GUA = Guava, LEM = Lemon, MRG = Moringa, OKR =Okra, PEP = Pepper, ROS = Roselle, SPN = Spinach, TMT = Tomato General Discussions Not much is known about the nutritive use of cadmium [11]. The mean cadmium concentration of 0.27 ± 0.06mg/dm3 is below the maximum permissible limit of 0.80mg/dm3 [3], this is also in line with the report by [19]. High intake of cadmium can lead to accumulation resulting in kidney damage [11]. Copper is an essential element, fruits and vagetables do not accumulate copper to levels that are likely to be toxic to animals and humans [26-27]. The mean copper concentration of 1.98 ± 0.15mg/dm3 obtained in this work is below the maximum permissible limit of 2.00mg/dm3 set by WHO [25], this is in line with [26-27]. Copper deficiency is very rare in human and some of its symptoms are depressed growth, bone demineralisation and depigmentation of the skin [17]. The mean chromium concentration of 4.48 ± 0.20mg/dm3 from all the samples analysed exceed the maximum permissible limit of 0.05mg/dm3 set by WHO [25]. The result is in agreement with the report of Godwin [9]. Chromium and its compound are known to cause cancer of the lung, nasal cavity and suspected to cause cancer of stomach and larynx [10]. The mean nickel concentration of 1.75 ± 0.13mg/dm3 from the samples analysed was much higher than the tolerable limit value of 0.02mg/dm3 set by WHO [25]. Nickel is a skin allergen, it penetrates the skin very slowly and appears distributed to all organs, primarily the kidneys, lungs and liver [2]. The principal vehicle for the transport of lead from the intestine to the various body tissues is the red blood cell in which lead is bound primarily to haemoglobin (Moore, 1988). The displayed mean concentration of 1.05 ± 0.13mg/dm3 found in lead from the samples analysed was much higher than the tolerable limit value of 0.05mg/dm3 established by WHO [26]. Acute lead poisoning in man causes severe dysfunction in the kidney, reproductive system, liver, the brain and central nervous system (Bhatia, 2006). Lead poisoning from environmental exposure may cause mental retardation in children, while mild lead poisoning causes anaemia [6]. Calcium is not known to be extremely toxic because it is an essential element in all living organisms for the development and maintenance of bones, teeth, muscles and reduction of blood cholesterol level [11]. The mean calcium concentration of 4.05 ± 0.20mg/dm3 from the samples analysed is below the maximum permissible limit of 7.5mg/dm3 [11]. Zinc is an essential element in all living organisms and many enzymes which are involved in a number of physiological functions such as protein synthesis and energy metabolism [18]. Exposure to zinc fumes lead to neusea, irrritation of eyes, nose and throat, pains in the chest with coughing, further inhalation also causes severe headache and vomitting [18]. The mean zinc concentration of 2.39 ± 0.11mg/dm3 from all the samples analysed is within the maximum permissible limit of 5.00mg/dm3 set by WHO [25]. This is also in line with [2]report. 165
A A Salisu et al ______________________________________________________________________________ J. Chem. Pharm. Res., 2013, 5(5):159-166 The mean cobalt concentration of 1.38 ± 0.10mg/dm3 from the samples analysed exceed the maximum permissible limit of 0.25mg/dm3. Acute toxicity of cobalt may be observed as effects on the lungs, including asthma, pneumonia and sneezing [1]. Cobalt is a possible carcinogen to humans, it causes cancer when placed directly into the muscle or under the skin [1]. The mean iron concentration of 0.32 ± 0.18mg/dm3 from all the samples analysed were within the maximum permissible limit of 0.30mg/dm3 set by WHO [25]. Autopsies have shown haemorrhagic necrosis and sloughing of areas of mucosa in the stomach with extension in to the submucosa [6]. Manganese is an essential element for many living organisms including humans (Ibrahim, 2008) [11]. The mean manganese concentration of 0.31 ± 0.02mg/dm3 from the samples analysed was within the maximum permissible limit of 0.50mg/dm3 set by WHO [25]. Manganese deficiency in animals exhibits impaired growth, skeletal abnormalities, reproductive deficits, ataxia of the new born and defects in lipid and carbohydrate metabolism [22]. CONCLUSION Analyses of the different types of fruits and vegetables showed that the concentrations of Mn, Cd, Zn, Fe, Cu and Ca were within the tolerable limits while that of Ni, Co, Pb, and Cr were above the permissible limits set by USEPA(1984) [21], this variation may be due to climatic conditions, soil fertility, maturity of the fruits and vegetables, the time at which they were harvested and the genetic control of the soil contents in which these fruits and vegetables were developed. All these are factors which contribute to the variation of the concentrations of the elements present in the fruits and vegetables. REFERENCES [1]YA Abbas,Department of Pure and Applied Chemistry, Bayero University, Kano, Nigeria, unpublished thesis. 2006, 3-9 [2]AN Agumadu,Department of Pure and Applied Chemistry, Bayero University, Kano, Nigeria, unpublished thess, 2009, 9-53. [3]IJ Alinnor,J. Chem. Soc. Nigeria, 2008, (33) 1,150-155 [4]JT Ayodele, and A. Ahmed,J. Chem. Soc. Nigeria, 1996,(21) 1, 80-85. [5]JT Ayodele, and ZN Ali,J. Chem. Soc. Of Nigeria. 2008,(2) 1,104-110. [6]TH Bothwell,Iron metabolism in man. Blackwell, Oxford, England, 1979,15-21. [7]CG Elinder,Iron, In: Friberg, L., Nordberg, GF, Vouk, VB (ed). Handbook on the Toxicology of Metals. Amsterdam, Elsevier Science Publishers, 1986, 664-679. [8]MA Funtua, EB Agbaji, and VO Ajibola,J. Chem.Soc.Nigeria,2008 (5)1, 11-14 [9]EN Godwin, J. Chem. Soc. Of Nigeria,2005 (30) 1,1-4. [10]HA Hueper, and CA Finch,Semin. Hematol, 1982, 19: 3-5. [11]AM Ibrahim,Department of Pure and Applied Chemistry, Bayero University, Kano, Nigeria, unpublished thesis, 2008, 5-13. [12]WA Knepper,Iron. In: Kirk-Othmer Encyclopedia of Chemical Toxicology. (13)NewYork, NY. Wiley Interscience, 1981, 735-753. [13]MA Kurawa, Biological and Environmental Sciences Journal For The Tropics (BEST) 2004, (1)1, 59-60. [14]MR Moore,Lancet.1981, 2, 203-204. [15]PC Njoku, J. Chem. Soc. Nigeria, 2008,(33)1,178-180. [16]IP Oboh and CU Edema,J. Chem. Soc. Nigeria, 2007,(32)2, 29-34. [17]PC Onianwa, AO Adeyemo, EO Iduwu and EE Ogabiela,J. Food chem 2001, 72, 89-95. [18]A Sale,Department of chemistry, Ahmadu Bello University, Zaria, Nigeria, Unpublished thesis, 1990, 3-11. [19]UOA Shu`aibu and JT Ayodele,J. Chem. Soc. Nigeria, 2002, (27) 1, 26-27. [20]F Suruchi and P Khanna,Research J. Env. Toxic., 2011,5(3): 162-179 [21] FW Sundermann, Jr. Aitiio, LM Morgan, and T Norscth, Toxicol. In. Health, 1980, 2, 17-78. [22]United States Environmental Protection Agency (USEPA)Manganese. Health Assessment Departments. Environmental Criteria and Assessment Office. Cincinnati, OH, USA., 1984, 11-25. [23]United States Environmental Protection Agency (USEPA): Health Issue Assessment. Cincinnati, OH, USA., 1987, 13-27. [24]World Health Organisation (WHO), Guidelines for Drinking Water Quality, WHO, Geneva, 1999, 160-220. [26]World Health Organisation (WHO),Guidelines for Drinking Water Quality, WHO, Geneva, 2003, 90-120. [27]MA Zwarsch and JG Mills,Canadian journal of soil science,1981, 2, 243-246. 166