Download
1 / 7
70 likes | 82 Views
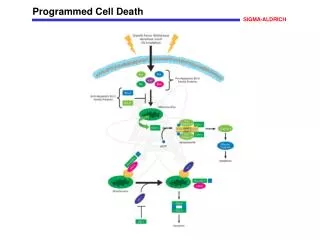
Programmed cell death (PCD) is essential for normal development and reproduction which is also induced by<br>various biotic or abiotic stresses including aluminum (Al) stress. Little is known about mechanisms of PCD induced<br>by Al stress. In the present study, biochemical and physiological features of Cryptococcus humicola were examined<br>under Al stress. Reactive oxygen species (ROS) accumulation and activation of caspase-3-like protease were<br>observed in cells treated by Al stresses. DAPI staining showed a nucleus aggregation in the cell edge, nuclear<br>chromatin condensation displaying a crescent-shaped distribution around the nucleus. Mitochondrial membrane<br>potential (∆Ψm) and mitochondrial cytochrome c (cyt c) content were decreased after Al stress. Cyt c gene<br>expression profiles analysis showed that the gene was up-regulated by Al stress. In summary, the physiological and<br>molecular analysis revealed that the cyt c and caspase-3-like protease involved in the yeast apoptosis process<br>triggered by Al stress. These results help understand the physiological mechanisms of Al stress-induced PCD<br>process in yeast. <br>

E N D
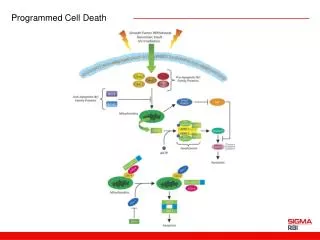
Available online www.jocpr.com Journal of Chemical and Pharmaceutical Research, 2013, 5(11):73-79 ISSN : 0975-7384 CODEN(USA) : JCPRC5 Research Article Mitochondrial cytochromec involvement in programmed cell deathinduced by aluminum stress in Cryptococcus humicola Li Jin-Jin, Pang Xiao-Lu, Zhang Jing-Jing, Lu Ming-Qian, Nian Hong-Juan* and Chen Li-Mei Biotechnology Research Center, Kunming University of Science and Technology, Kunming, China ____________________________________________________________________________________________ ABSTRACT Programmed cell death (PCD) is essential for normal development and reproduction which is also induced by various biotic or abiotic stresses including aluminum (Al) stress. Little is known about mechanisms of PCD induced by Al stress. In the present study, biochemical and physiological features of Cryptococcus humicola were examined under Al stress. Reactive oxygen species (ROS) accumulation and activation of caspase-3-like protease were observed in cells treated by Al stresses. DAPI staining showed a nucleus aggregation in the cell edge, nuclear chromatin condensation displaying a crescent-shaped distribution around the nucleus. Mitochondrial membrane potential (∆Ψm) and mitochondrial cytochrome c (cyt c) content were decreased after Al stress. Cyt c gene expression profiles analysis showed that the gene was up-regulated by Al stress. In summary, the physiological and molecular analysis revealed that the cyt c and caspase-3-like protease involved in the yeast apoptosis process triggered by Al stress. These results help understand the physiological mechanisms of Al stress-induced PCD process in yeast. Keywords: Cryptococcus humicola,Aluminum stress, Programmed cell death, Mitochondria, Cytochrome c. ____________________________________________________________________________________________ INTRODUCTION Programmed cell death (PCD), which is an active genetically regulated physiological process, is essential for normal development and reproduction. PCD is also induced by various biotic or abiotic stresses such as hypersensitive response during pathogen attack [1], heat [2-3], UV-C irradiation [4-5], salt stress-induction [6] or upon H2O2 induction [7]. PCD shares many morphological and biochemical features with apoptosis, such as nuclear DNA fragmentation, chromatin condensation, production of reactive oxygen species (ROS), decrease in mitochondrion membrane potential (∆Ψm), release of cytochrome c (cyt c) from mitochondria, an activity increase of caspase-like enzymes. Mitochondria not only are the center of energy production but also play important roles in regulation of apoptosis. The increase of mitochondrial outer membrane permeabilization is considered to be an initial step in the process of apoptosis redistributions from the mitochondria to the cytosol. Among these proteins, cyt c was a component of the mitochondrial respiratory chain. Studies showed that cyt c release from mitochondria to the cytoplasm during PCD process [9]. The release of cyt c constitute positive feedback regulation mechanism which lead to electron transfer chain disruptions, the rise of intracellular ROS, loss of membrane potential and the mitochondrial ATP production function. In our previous study, C. humicola was found to undergo a PCD process trigged by Al stress [10]. The aim of the present investigation was to evaluate how Al treatment affect cell survival by assessing several typical apoptosis features and whether cyt c participate in cell PCD induced by Al stress. [8]. Disruption of the outer mitochondrial membrane results in some apoptosis related protein 73
Nian Hong-Juan et al ______________________________________________________________________________ J. Chem. Pharm. Res., 2013, 5(11):73-79 EXPERIMENTAL SECTION Microorganisms and growth conditions BSLL1-1 is an Al-resistant C. humicola strain that was isolated from a tea field in the Yunnan province [11]. Cells were cultured at 28 ℃ in GM (glucose, 1.0 %; peptone, 0.05 %; yeast extract, 0.02 %) medium [12] at pH 3.5. Cell cultures and collections The C. humicola strain BSLL1-1was pre-incubated on a solid GM agar plate for 36h, then one single colony was selected to culture in GM liquid culture medium overnight. The 1% inoculation amount was transferred to fresh GM liquid medium and incubated at 28 ℃ for 16h while shaking at 200 rpm. After harvest, the cells were collected by centrifugation, washed three times in phosphate buffered saline (PBS, pH 7.4) for further experiments. Al stress treatments The equal amount of yeast cells were treated with 0, 50, 100, 150 or 200 mM AlCl3 for 60 min at 28 ℃ or treated with 50 mM AlCl3 for 0, 30, 60 or 90min at 28 ℃. The cells were collected, washed in PBS (pH 7.4) and then used for the extraction of mitochondria. Isolation of mitochondria Isolation of mitochondria was done according to the method of Jin et al [13]. DAPI (4', 6-diamidino-2-phenylindole) staining The cells were stained using the KeyGEN Cell apoptosis DAPI detection kit according to the manufacturer’s instructions (KeyGen, Nanjing, China). In brief, the cells were treated with 200 mM AlCl3 for 0, 1, or 4 h. After harvest, the cells were fixed in 1 % paraformaldehyd at room temperature (RT) for 15 min and then were washed for 5 min with ddH2O. Fixed cells were stained with 0.2 µg/ml DAPI at 37 ℃ for 15 min in the dark. The cells were washed with PBS for 5 min and resuspended in Buffer A. Then cells were viewed and photographed in a fluorescence microscope (Leitz Dialux 20, Wetzlar, Germany) with a digital camera (Canon PowerShot G5, Tokio, Japan). 50 cells were analyzed per concentration and time point. Each experiment was performed three times in total using independent cell cultures. Measurement of caspase-3-like activity Yeast cells were treated with 0, 20, 50, 100, 150 or 200 mM AlCl3 for 6 h at 28 ℃ while shaking at 100 rpm. Cells were harvested, washed in PBS (pH 7.4) and then collected by centrifugation. The activity of caspase-3-like enzymes was assayed using the ‘Kerogen caspase-3 colorimetric assay kit’ (KeyGen, Nanjing, China) according to the manufacturer’s instructions.Ac-DEVD-pNA, a substrate for the colorimetric determination of caspase 3 activity, was added to the cell extracts of control and treated cells. The reaction mixtures were incubated for 2 h at 37℃. Caspase 3-like activity was determined by spectrophotometric quantification of the free pNA (λem=405 nm). The ratios of the caspase-3-like activity of treated cells versus control cells were calculated and averaged from three independent experiments. Detection of ROS production The equal amount of cells was treated with 0, 100 or 200 mM AlCl3 for 6 h at 28 ℃. The control and treated cells were stained with 100 µM 2’, 7’-dichlorofluorescin diacetate (H2DCFDA) (Invitrogen, Eugene, USA) for 30 min at room temperature. H2DCFDA is a cell permeable non-fluorescent dye. It can be intracellularly de-esterified and changed into highly fluorescent 2’, 7’-dichlorofluorescin (DCF) upon oxidation by intracellular hydrogen peroxide and other peroxides. Cells were observed in an epifluorescence microscope (LEICA DMR) using an excitation wavelength of 480 nm. Measurement of mitochondrial membrane potential (∆Ψm) Measurement of ∆Ψm referenced the method described in the literature [14]. Mitochondrial protein concentration was adjusted to 1mg/ml. 100µl mitochondria was taken and mixed with 1 ml liquid A (D-Mannitol 220 mmol/l, Sucrose 70 mmol/l, HEPES 2 mmol/l and K2HPO4 2 mmol/l, pH7.0), then incubated at 37 for 5min for 5min at 12000rpm (4℃), the supernatant was used to measure the outer mitochondrial Rhodamine 123 concentration [Xout] at the wavelength of 500nm. Set the mitochondrial matrix volume was 1 µ l/ µ g protein, concentration of mitochondria Rhodamine 123 [Xin]=(3-3.1×[Xout])×10000/Protein concentration. ∆Ψm was calculated according to Nemst equation: ∆Ψm=59.5 lg[Xin]/[Xout]. Three independent experiments, each with three replicates, were performed. . After centrifugation ℃ 74
Nian Hong-Juan et al ______________________________________________________________________________ J. Chem. Pharm. Res., 2013, 5(11):73-79 Assays of mitochondrial cyt c/a Mitochondrial cyt c/a was measured as described previously [15]. Isolated mitochondria were suspended in 0.2% (W/V) BSA and adjusted the mitochondrial protein concentration to about 0.5 mg/mL. Absorbance was measured at 550 nm and 630 nm using UV spectrophotometer (Shimadzu, Japan). Ratio of the two absorption values is cyt c/ a. The assay repeated three times. Measurement of mitochondrial cyt c content The mitochondrial suspension was used to damage the mitochondrial membrane with a sonicator. The mitochondrial cyt c content was determined as described by Zhang [16]. 0.2, 0.4, 0.6, 0.8, 1.0 mL of 0.1 mmol / L cyt c standard was added the test tube, then 1.3, 1.1, 0.9, 0.7, 0.5 mL of ddH2O was add, respectively, in each tube to get volum of 1.5 mL. 10 mg of sodium dithionite was added in the volum. Optical density value was assayed at 520 nm and the standard curve was drawn. The concentration was calculated based on the optical density values of the sample. cyt c content=3.71×OD520×dilutions×Final volume. Three independent experiments, each with three replicates, were performed. RT-PCR analysis The equal yeast cells treated with 0, 20, 50, 100 or 200 mM AlCl3 for 6 h and 50 mM AlCl3 for 0, 2, 4, 6 or 8 h were harvested, and total RNA was extracted using the Trizol reagent (Invitrogen, USA). Genomic DNA was removed using DNase I. First-strand cDNA was synthesized from the total RNA (5µg) using M-MLV reverse transcriptase (Promega, USA) according to the manufacturer’s instructions. The size of the predicted PCR products was approximately 327 bp. The primer pairs are as follows: Forward: 5’-GAATTCATGTCCTACGCTGCCGGTGACGTCG-3’, Reverse: 5’-GCGGCCGCTTACTTGGTCTCCTTCTCGAGGAAG-3’. The PCR reaction mixtures (20 µl) contained 16.1 µl of sterile water, 2 µl of 10×Taq reaction buffer, 0.02µl of primers (100 lµM), 0.2 µl of dNTPs (10 µM each), 1 U of Taq DNA polymerase (Tiangen, Beijing, China) and 2µl of cDNA (200 ng/µl). Yeast 18s rRNA was used as the internal control The PCR products were examined by electrophoresis on a 1% agarose/EtBr gel in 1×TAE buffer. Quantification of PCR products was estimated using the Volume Rect Tool of Quantity one 1-D analysis software. RESULTS AND DISCUSSION Al stress induced yeast cell apoptosis Chromatin condensation, a PCD hallmark, was analyzed through analysis of nuclear morphology and plasma membrane integrity by co-staining cells with DAPI. Results of DAPI stain showed that the nuclear morphology of control cells (cells without Al treatment) was round and dyeing uniformity. The nucleus of cells treated by Al appeared features of apoptosis: the nucleus in the cell edge aggregation, nuclear chromatin condensation showed the crescent-shaped distribution inside the nucleus and a dense stain. With the increase of treatment time, the features of apoptosis became more obviously. Part of yeast cells have began to enter the early stages of apoptosis when the cells treated by 200 mM Al for 1 h. More cells undergo apoptosis with time of Al treatment. Most of the cells entered stage of late apoptosis after 4 h treatment (Fig 1). a c Fig1. DAPI staining of yeast cells exposed to 200 mM Al in different time. 0h (a), 1h (b), 4h (c) 75
Nian Hong-Juan et al ______________________________________________________________________________ J. Chem. Pharm. Res., 2013, 5(11):73-79 Activation of caspase-3-like protease Fig.2 Caspase-3-like activity in control cells (0) and cells treated by 20, 50, 100, 150, 200mM Al Data are means ± SD of three independent replicates. Cells were treated by different concentrations of Al for 6 h. * indicates that the value is significantly different from the control (P< 0.05) Caspases are key enzymes in the apoptotic pathway of higher eukaryotes. Two distinct pathways for induced apoptosis were proposed. One was carried out through the caspase-independent pathway. The other was triggered through the mitochondrial caspase-dependent pathway which involves the mitochondrial release of cyt c enhancing caspase-9 activity [17, 18]. The activated caspase-9 can activate caspase-3[19]. Caspase-3 has been considered to be critical in the course of apoptosis, which kills the cells by cleaving a wide range of protein substrates [20-22]. Caspase-3 spectrophotometric assay kit provides a simple and convenient means for assaying the activity of caspases. The assay is based on spectrophotometric detection of the chromophore p-nitroaniline (p-NA) after cleavage from the labeled substrate DEVD-pNA. The p-NA light emission can be quantified using a spectrophotometer at 405 nm. Caspase-3-like activity was measured in C. humicola cells. Cleavage of the caspase 3 synthetic substrate DEVD-p-nitroaniline (DEVD-pNA) was observed in cell extracts of Al-treated cells. After 6 h treatment of Al, the activity of caspase-3-like enzyme increased significantly when compared to controls (Fig. 2). We observed 48.9% increase in caspase-3-like activity in treated cells after 6 h treatment of 50 mM Al. Activity of this enzyme in cells treated by 200 mM Al increased to 132.4% of the control level. These results indicated that Al stress activated the caspase-3-like activity and activation of caspase-3-like enzyme was a pivotal event in the apoptosis induced by Al stress. Darehshouri et al[7] used the ‘Caspase-3 DEVD-R110 Fluorometric & Colorimetric Assay Kit’ for measuring the activity of caspase-3-like enzymes of green alga Micrasterias in H2O2 treated cells, the activity of caspase-3-like enzymes was increased, which is consistent with our results in this work. Al stress lead to ROS accumulation Fig.3 Intracellular reactive oxygen species (ROS) production of yeast cells exposed to different Al concentration 0mM (a), 100mM (b), 200mM (c) Our previous data showed that Al stress causes strong oxidative damage to cells [10]. To determine whether Al stress induced the production of ROS in C. humicola cells, 2’, 7’-dichlorofluorescin diacetate (H2DCFDA) was used to stain samples from control and treated cells. As shown in Fig. 3, fluorescence microscopy revealed a significant ROS production in Al-treated cells when compared with the controls. Moreover, the higher the Al concentration, the more yeast cells accumulated ROS. This result was consistency with that reported by P Ludovico et al [23]. c a b 76
Nian Hong-Juan et al ______________________________________________________________________________ J. Chem. Pharm. Res., 2013, 5(11):73-79 Al stress decreased mitochondrial membrane potential (∆Ψm) A B Fig.4 Mitochondrial membrane potential (∆Ψm) of yeast cells treated with 0, 50, 100, 150 or 200 mM Al for 60 min (A) or treated with 50 mM Al for 0, 30, 60 or 90min (B) Data are means of three replicates +SE. * indicates that the value is significantly different from the control (P< 0.05) ∆Ψm is an important parameter for mitochondrial function. Studies on mammalian apoptosis reported an increase in ∆Ψm after a lethal stimulus, with ∆Ψm decreasing later in the death process [24, 25]. By spectrophotometry methods, we found that ∆Ψ m was decreased when the yeast cells were under Al stress. ∆Ψm of cells 60 min after treatment with 50 mM Al decreased 14.1% and ∆Ψm of cells 60 min after treatment with 200 mM Al reduced 34.1% when compared to the controls (Fig.4A). Similar results were observed when cells were treated with 50 mM Al for different time. The ∆Ψm of cells treated by Al for 30 min and for 90 min were decreased 10.6% and 17.6% compared to the control level, respectively. The longer of the treatment time, the lower of the ∆Ψm (Fig.4B). P Ludovico et al [17] using the flow cytometric analysis found a decreased mitochondrial ∆Ψm. However, although with a lower ∆Ψm, cells maintained the specific mitochondria staining indicating that mitochondria membrane integrity is still preserved (Data not shown). We assume that mitochondrial permeability transition pore (MPTP), which is a high conductance channel of the inner membrane whose opening leads to an increase of permeability to solutes, open gradually when the yeast cells were stressed by Al, then led to a decreased ∆Ψm and destroyed mitochondrial membrane integrity. Decrease of mitochondrial cyt c/a after Al stress A B Fig.5 Mitochondrial cyt c/a of yeast cells treated with 0, 50, 100, 150 or 200 mM Al for 60 min (A) and treated with 50 mM Al for 0, 30, 60 or 90min (B) Data are means of three replicates +SE. *indicates that the value is significantly different from the control (P< 0.05) Cyt c is loosely bound to the phospholipids outside of inner mitochondrial membrane, not freely pass through the outer mitochondrial membrane, while cyt A is tightly combined with the inner mitochondrial membrane. cyt c/a can reflect the content change of mitochondrial membrane cyt c. The value of mitochondrial cyt c/a decreased as Al concentration increasing. Mitochondrial cyt c/a of controls was 2.47, while the value was 1.72, 1.47, 1.34 and 1.25 when the cells were treated with 50, 100, 150 or 200 mM Al for 60 min, respectively (Fig.5A). Similar results were observed when cells were treated with 50 mM Al for 30, 60, 90 min. The cyt c/a also showed a downward trend (Fig.5B). 77
Nian Hong-Juan et al ______________________________________________________________________________ J. Chem. Pharm. Res., 2013, 5(11):73-79 Effect of Al stress on mitochondrial cyt c A B Fig.6 Mitochondrial cyt c content of yeast cells treated with 0, 50, 100, 150 or 200 mM Al for 60 min (A) and Mitochondrial cyt c content of yeast cells treated with 50 mM Al for 0, 30, 60 or 90min (B) Data are means of three replicates +SE. *indicates that the value is significantly different from the control (P< 0.05) With increasing concentration of Al or treatment time, the content of mitochondrial cyt c decreased significantly. The content of mitochondrial cyt c decreased 21.1% and 71.1% after 60 min treatment of 50 mM and 200 mM Al when compared with the control, respectively (Fig.6A). Similar results were obtained after treatment with 50 mM Al for different time. The content decreased 15.8% and 31.6% after 30 min and 90 min treatment, respectively (Fig.6B). These results suggested that the mitochondrial cyt c may release to the cytoplasm after the Al stress. By western-blot and cyt c spectra analysis, P Ludovico et al [23] showed that cyt c released from mitochondria to cytosol and the amount of cyt c in mitochondria was decreased in S. cerevisiae cells undergoing acetic acid-induced PCD. The western-blot analysis of mitochondrial cyt c release to cytosol in C. humicola will be done in the future Al stress up-regulated cyt c gene B A b aa Fig.7 RT-PCR analysis of the expression profiles and the relative expression of the cyt c genes in cells exposed to Al stresses (A) Expression of cyt c in cells induced by different concentrations of Al. (B) Expression of cyt c in cells induced by 50 mM Al in different time point. (a) Relative expression of cyt c gene in cells induced different concentrations of Al. (b) Relative expression of cyt c gene in cells induced by 50 mM Al in different time point RT-PCR analysis showed that the expression of cyt c gene was up-regulated by Al stress. During the whole Al-exposure period, expression levels of cyt c displayed a obvious increasing trend as compared with their initial levels (Fig.7A, B). After 6 h treatment with 20, 50, 100 or 200 mM Al, expression levels of cyt c increased 30%, 75%, 108% and 112% when compared to the controls, respectively (Fig.7a). Similar results were obtained when cells were treated with 50 mM Al for 2, 4, 6 or 8 h, of which the expression levels of cyt c increased 11%, 42%, 52% and 57 % when compared to the controls, respectively(Fig.7b). The cyt c gene expression profiles were analyzed, 78
Nian Hong-Juan et al ______________________________________________________________________________ J. Chem. Pharm. Res., 2013, 5(11):73-79 the expression was up-regulated by Al stress. CONCLUSION In summary, we found ROS accumulation and activation of caspase-3-like protease in cells treated by Al stresses. PCD cells showed a nucleus aggregation in the cell edge, nuclear chromatin condensation displaying a crescent-shaped distribution around the nucleus. Mitochondrial ∆Ψm and mitochondrial cyt c content were decreased after Al stress. Cyt c gene expression was up-regulated by Al stress. These findings suggested that caspase-3-like protease and mitochondrial cyt c involved in Al-induced PCD process. Acknowledgments This work was supported by the National Natural Science Foundation of China (31160020). REFERENCES [1]JT Greenberg; N Yao. Cell. Microbiol., 2004, 6 (3): 201-211. [2]T Fan; T Xing. Biologia. Plantarum., 2004, 48: 389-394. [3]A Zuppini; C Andreoli; B Baldan. Plant. Cell. Physiol., 2007, 48 (7), 1000-1009. [4]A Danon; P Gallois. FEBS. Lett., 1998, 437(1-2), 131-136. [5]S Moharikar; JS D’Souza; AB Kulkarni; BJ Rao. J. Phycol., 2006, 42 (2): 423-433. [6]MJ Affenzeller; A Darehshouri; A Andosch. J. Exp. Bot., 2009, 60 (3): 939-954. [7]A Darehshouri; M Affenzeller; U Lütz-Meindl. Plant. Biol., 2008, 10(6): 732-745. [8]TD Hewitson, IA Darby. Methods. Mol. Biol., 2010, 611:161-170. [9]H Yoshida. Cell., 1998, 94(6):739-750. [10]HJ Nian; GQ Wang; LM Chen. World. J. Microbiol. Biotechnol., 2012, 28(6): 2319-2329. [11]HJ Nian; GQ Wang; LW Zhao; YX Yu; KZ Li; LM Chen. J. Biol. Res-Thessalon., 2012, 18: 227-234. [12]F Kawai; D Zhang; M Sugimoto. FEMS. Microbiol. Lett., 2000, 189: 143-147. [13]JL Jin; D Gao; ZD Sun. Genetic., 1996, 18(2):46-48. [14]XY Fu; XK Liu; T Yu. Chinese. J. Anesthesiol., 2007, 27(10): 881-885. [15]AV Tonshin; VB Saprunova; IM Solodovnikova; LE Bakeeva; LS Yaguzhinsky .Biochem (Moscow)., 2003, 68(8):875-881. [16]JT Zhang. Beijing: Chinese Peking Union Medical College Press, 1998. [17]C Du; M Fang; Y Li; L Li; X Wang. Cell., 2000, 102(1): 33-42. [18]V Gogvadze; S Orrenius; B Zhivotovsky. Biochim. Biophy. Acta., 2006, 1757(5-6): 639-647. [19]XM Fang; MZ Chen; RL Chen. Sect. Clin. Biochem & Lab. Med. Foreign. Med. Sci., 2005, 26 (1): 43-46. [20]SH Oh; JE Choi; SC Lim. Toxicology., 2006, 220: 1-12. [21]M Kondoh; S Araragi; K Sato; M Higashimoto; M Takiguchi; M Sato.Toxicology., 2002, 170(1-2): 111-117. [22]Y Shi. J. Cancer. Mol., 2005, 1: 9-18. [23]P Ludovico; F Rodrigues; A Almeida; MT Silva; A Barrientos; M Côrte-Real. Mol. Biol. Cell., 2002, 13 (8): 2598-2606. [24]MG Vander Heiden; NS Chandel; EK Williamson; PT Schumacker, CB Thompson. Cell., 1997, 91(5):627-637. [25]MG Vander Heiden; NS Chandel; PT Schumacker; CB Thompson. Mol. Cell., 1999, 3(2):159-167. 79