Download
1 / 13
130 likes | 140 Views
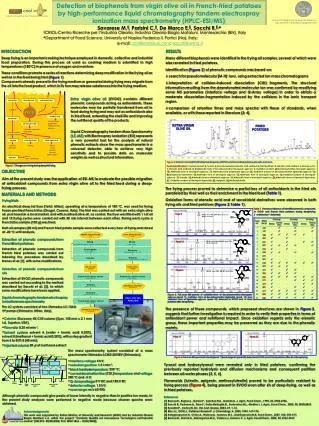
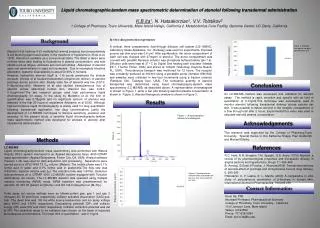
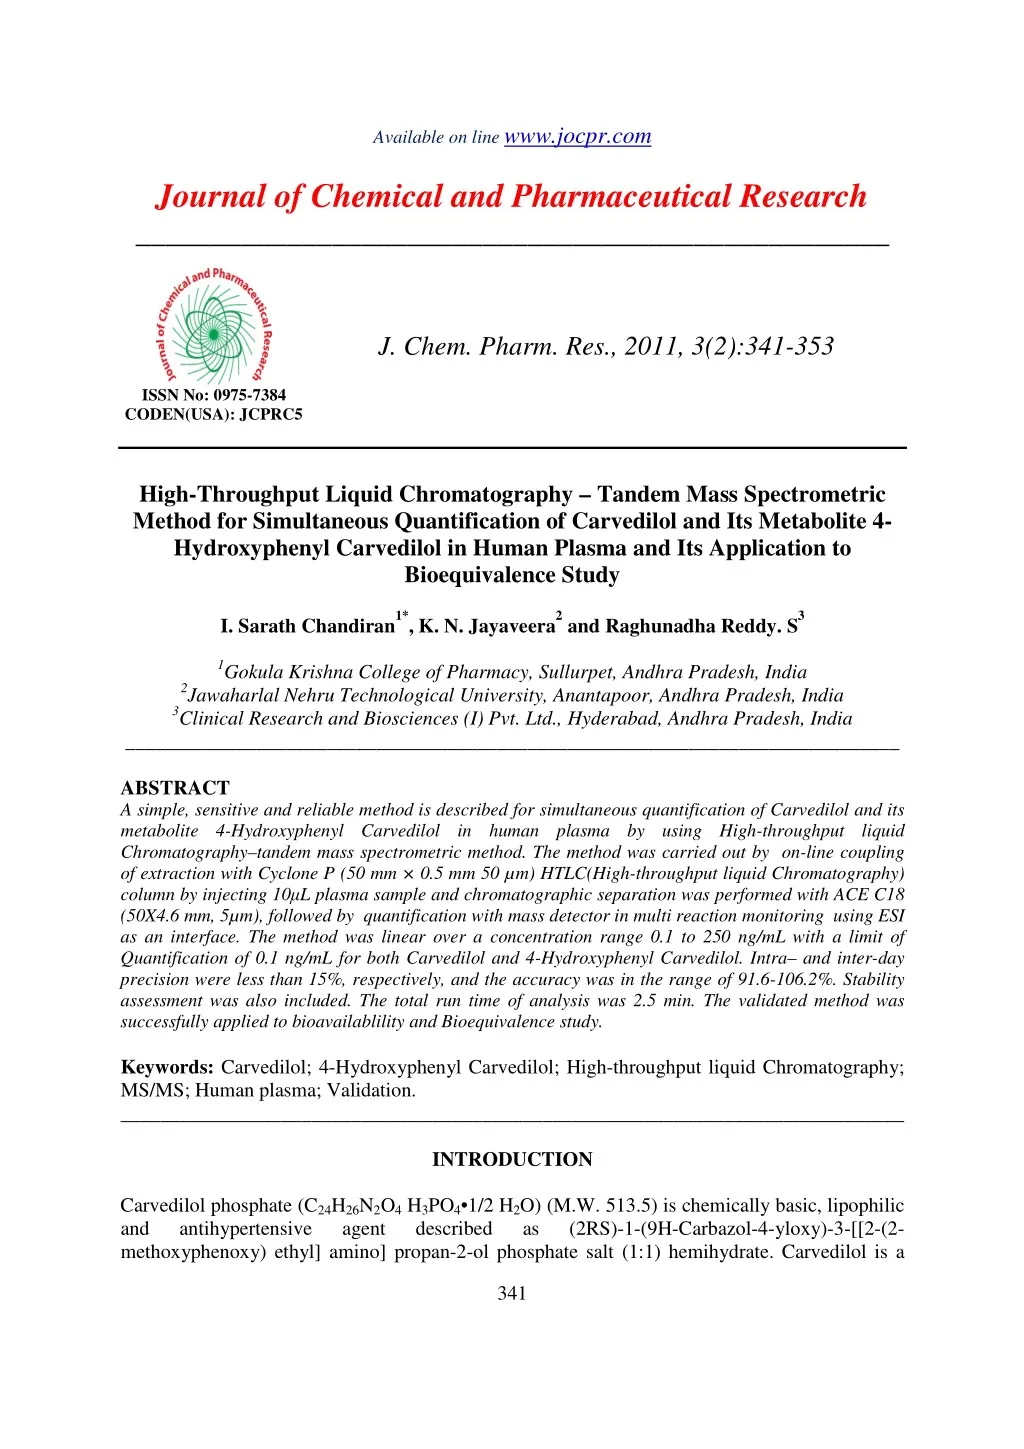
A simple, sensitive and reliable method is described for simultaneous quantification of Carvedilol and its metabolite 4-Hydroxyphenyl Carvedilol in human plasma by using High-throughput liquid Chromatography–tandem mass spectrometric method. The method was carried out by on-line coupling of extraction with Cyclone P (50 mm × 0.5 mm 50 µm) HTLC(High-throughput liquid Chromatography) column by injecting 10µL plasma sample and chromatographic separation was performed with ACE C18 (50X4.6 mm, 5µm), followed by quantification with mass detector in multi reaction monitoring using ESI as an interface. The method was linear over a concentration range 0.1 to 250 ng/mL with a limit of<br>Quantification of 0.1 ng/mL for both Carvedilol and 4-Hydroxyphenyl Carvedilol. Intra– and inter-day<br>precision were less than 15%, respectively, and the accuracy was in the range of 91.6-106.2%. Stability<br>assessment was also included. The total run time of analysis was 2.5 min. The validated method was<br>successfully applied to bioavailablility and Bioequivalence study. <br>

E N D
Available on line www.jocpr.com Journal of Chemical and Pharmaceutical Research __________________________________________________ J. Chem. Pharm. Res., 2011, 3(2):341-353 ISSN No: 0975-7384 CODEN(USA): JCPRC5 High-Throughput Liquid Chromatography – Tandem Mass Spectrometric Method for Simultaneous Quantification of Carvedilol and Its Metabolite 4- Hydroxyphenyl Carvedilol in Human Plasma and Its Application to Bioequivalence Study 1*, K. N. Jayaveera 2 and Raghunadha Reddy. S 3 I. Sarath Chandiran 1Gokula Krishna College of Pharmacy, Sullurpet, Andhra Pradesh, India 2Jawaharlal Nehru Technological University, Anantapoor, Andhra Pradesh, India 3Clinical Research and Biosciences (I) Pvt. Ltd., Hyderabad, Andhra Pradesh, India _____________________________________________________________________________ ABSTRACT A simple, sensitive and reliable method is described for simultaneous quantification of Carvedilol and its metabolite 4-Hydroxyphenyl Carvedilolin human plasma by using High-throughput liquid Chromatography–tandem mass spectrometric method. The method was carried out by on-line coupling of extraction with Cyclone P (50 mm × 0.5 mm 50 µm) HTLC(High-throughput liquid Chromatography) column by injecting 10µL plasma sample and chromatographic separation was performed with ACE C18 (50X4.6 mm, 5µm), followed by quantification with mass detector in multi reaction monitoring using ESI as an interface. The method was linear over a concentration range 0.1 to 250 ng/mL with a limit of Quantification of 0.1 ng/mL for both Carvedilol and 4-Hydroxyphenyl Carvedilol. Intra– and inter-day precision were less than 15%, respectively, and the accuracy was in the range of 91.6-106.2%. Stability assessment was also included. The total run time of analysis was 2.5 min. The validated method was successfully applied to bioavailablility and Bioequivalence study. Keywords: Carvedilol; 4-Hydroxyphenyl Carvedilol; High-throughput liquid Chromatography; MS/MS; Human plasma; Validation. ______________________________________________________________________________ INTRODUCTION Carvedilol phosphate (C24H26N2O4 H3PO4•1/2 H2O) (M.W. 513.5) is chemically basic, lipophilic and antihypertensive agent described methoxyphenoxy) ethyl] amino] propan-2-ol phosphate salt (1:1) hemihydrate. Carvedilol is a as (2RS)-1-(9H-Carbazol-4-yloxy)-3-[[2-(2- 341
et al J. Chem. Pharm. Res., 2011, 3(2):341-353 I. Sarath Chandiran ______________________________________________________________________________ racemic mixture in which nonselective β-adrenoreceptor blocking activity [1, 2] is present in the S (-) enantiomer and α1-adrenergic blocking activity is present in both R (+) and S (-) enantiomers [3, 4] at equal potency. Carvedilol has no intrinsic sympathomimetic activity. Carvedilol is more than 98% bound to plasma proteins, primarily with albumin. The plasma- protein binding is independent of concentration over the therapeutic range. Carvedilol is used in the treatment of mild to moderate hypertension; angina pectoris [5], congestive heart failure [6, 7, 8] and possess antioxidative effects in vivo [9]. The plasma concentrations of the Carvedilol are very low due to its extensive metabolism following oral administration in humans and the 4'- hydroxyphenyl metabolite is approximately 13 times more potent than Carvedilol for β-blockade. Therefore, the quantification of Carvedilol in Plasma requires a Bioanalytical method with high sensitivity. The actual plasma concentrations of Parent drug and/or metabolite(s) are of major interest in pharmacokinetic studies. However, the Metabolite of Carvedilol, which is the more abundant and circulates in blood, was used to document the pharmacokinetic profile of Carvedilol. Carvedilol had been determined in plasma and other biological fluids such as high performance liquid chromatography coupled to fluorometric detection [6, 10-18], high performance liquid chromatography coupled to ultra-violet detection [18], and capillary electrophoresis coupled to ultra-violet detection [18-19], capillary electrophoresis coupled with laser-induced fluorescence[20], high performance liquid chromatography coupled to electrochemical detection [21], high performance liquid chromatography coupled to tandem mass spectrometry [22,23]. This present work reports the first automated high-throughput liquid chromatography tandem mass spectrometric method developed and validated for simultaneous quantification of Carvedilol and its metabolite 4-Hydroxyphenyl Carvedilol in human plasma using Propranolol as an internal standard. Robotic liquid handling systems were employed to all liquid transfer steps including the sample preparation procedure as well as to the addition/removal of the organic solvent. The current method includes a simple, rapid sample preparation and extraction as a result of robotic systems utilization that enabled parallel processing as well as shorter analysis run time with simultaneous quantification of Carvedilol and its metabolite 4-Hydroxyphenyl Carvedilol in human plasma when compared to previously published methods. EXPERIMENTAL SECTION 2.1. Chemicals and reagents Carvedilol Phosphate and 4-Hydroxyphenyl Carvedilol were commercially procured from Zach system (S.P.A., Italy) and Vivan life sciences (Mumbai, India). Propranolol was supplied by Toronto research Chemicals (Mumbai, India). The assay contents of Carvedilol Phosphate, 4- Hydroxyphenyl Carvedilol and Propranolol were 99.76%, 98.0% and 99.90% (on as is basis). All the solvents used were of HPLC grade. HPLC grade acetonitrile and methanol were obtained from J.T.Bakers (Mumbai, India). Formic acid, Ammonium formate, isopropyl alcohol and acetone were obtained from Merck (Worli, Mumbai, India). Drug free and Healthy human plasma was obtained from Clinical Research (I) Laboratory (Hyderabad, Andhra Pradesh, India). Water was deionized, filtered and purified on a Sartorius apparatus. 342
et al J. Chem. Pharm. Res., 2011, 3(2):341-353 I. Sarath Chandiran ______________________________________________________________________________ 2.2. Data processing Chromatograms were acquired on a TSQ tandem mass spectrometry (Thermo Finnigan, Sanjose, CA, USA) equipped with Electrospray ionization (ESI) and connected to a PC runs with the standard software Xcalibur 2.0.7 and LC Quan 2.5.6. Mass spectroscopic detection was performed on a Triple quadrapole instrument (Thermo, TSQ Quantum Discovery Max). Robotic liquid handling system was operated using the software package supplied from the cohesive technologies AriaTM. The calibration curve was constructed by weighted 1/x2 least-square linear regression analysis of the peak area ratio (drug/IS) vs. the concentration of drug and (metabolite/IS) vs. the concentration of metabolite. 2.3. Standard solutions preparation 2.3.1. Stock solution preparation Approximately 2 mg of Carvedilol (A)/ 2 mg of 4-Hydroxyphenyl Carvedilol (B)/2 mg of Propranolol (ISTD) working standard was weighed and transferred to 10.0 mL volumetric flask, to this 5.0 mL of Methanol was added and sonicated to aid dissolution and the final volume was made up with Methanol. 2.3.2. Preparation of internal standard dilution The Propranolol internal standard (ISTD) dilution of about 100ng/mL from the ISTD stock solution(IS stock) using (70:30 methanol: water) as the diluent was prepared. 2.3.3. Preparation of calibration curve (CC) standards and quality control (QC) samples Appropriate dilutions of the stock solutions with diluent were made subsequently in order to prepare the working standard solution in the range of 5.0 - 12.5 µg/ml for A and B respectively. All the Solutions were stored in a refrigerator between 2°C and 8°C. Calibration standards (0.1, 0.7, 1.6, 5.8, 15.0, 55.0, 126.0 and 252.0 ng/mL) and quality control Samples (200.0, 100.0, 1.25 and 0.5 ng/mL) for A and B were prepared for calibration. Accuracy and precision, quality control and stability assessment were done by spiking 0.1 mL of drug free plasma with appropriate volume of working solution. 2.4. Solutions used for robotic on-line sample extraction system Pure Acetonitrile was used in pump A, 0.15% formic acid was used in pump B, 10 mM ammonium formate buffer was used in pump C and washing solution in the ratio of 10:20:70 (Acetone: IPA: Acetonitrile) was used in pump D. 2.5. Sample preparation The frozen CC, QC and subject samples from the deep freezer were retrieved, thawed in water bath maintained at room temperature and vortexed. The caps were removed from the polypropylene tubes. 0.100 mL (100µL) of CC, QC and subject samples was aliquoted into pre-labelled HPLC vials. 25.0 µL of ISTD Dilution (100 ng/mL) was added followed by 50.0 µL of 10mM Ammonium formate buffer of pH 7.8 into HPLC vials. The HPLC vials were capped, vortexed to mix and transferred to auto sampler. 343
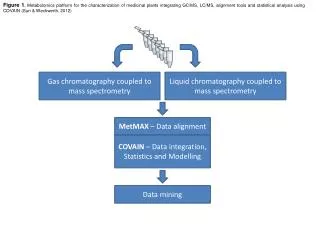
et al J. Chem. Pharm. Res., 2011, 3(2):341-353 I. Sarath Chandiran ______________________________________________________________________________ RESULTS AND DISCUSSION 3.1. Chromatographic and mass spectrometric conditions The LC/MS/MS system consisted of four pumps for gradient solvent delivery, and a divert valve to direct LC effluent to the mass spectrometer in the analyte elution window. The analytical column effluent is directed through the divert valve to a thermo electron TSQ quantum discovery mass spectrometer. Source specific and compound specific parameters are presented in Table 1. Table 1: Source specific and Compound specific mass spectrometric parameters Parameters Source Specific Spray voltage Auxiliary Gas Spray Gas Capillary Temperature MS/MS (MRM) 4500 45 Psi 8 cm3 min-1 300 °C 4-Hydroxyphenyl Carvedilol Carvedilol Propranolol (IS) Collision energy (CE) Tube lens offset Skimmer offset 22 95 06 15 70 08 38 61 09 The instrument was operated in the positive ion mode. The precursor [M·H]+ ions at m/z 407.113, 423.528 and 260.200 for Carvedilol, 4-Hydroxyphenyl Carvedilol and Propranolol respectively were selected by the first quadrupole (Q1). After collision-induced fragmentation in Q2, the product ions at m/z 224.503, 100.344 and 116.100 for Carvedilol, 4-Hydroxyphenyl Carvedilol and Propranolol, respectively, were monitored in Q3.A resolution of one unit (at half peak height) was used for both Q1 and Q3. The full mass spectra’s for the Carvedilol, 4- Hydroxyphenyl Carvedilol and Propranolol are shown in Fig.1. 344
et al J. Chem. Pharm. Res., 2011, 3(2):341-353 I. Sarath Chandiran ______________________________________________________________________________ Fig.1. Full mass spectra for the Carvedilol, 4-Hydroxyphenyl Carvedilol and Propranolol 3.1.1. Steps involved in on-line robotic method development A typical two-column setup featuring two six-port switching valves as described by Herman [24] was employed for method development. The procedure consisted of four steps: (1) The eluent loop was filled with 50% acetonitrile in 10 mM ammonium formate. (2) 10µL sample was loaded onto the Cyclone P (50 mm × 0.5 mm, 50 µm) HTLC(High- throughput liquid Chromatography) column at a flow rate of 2 mL/min during 30 s. (3) The eluent loop was discharged at 0.5 mL/min for 30 s to transfer the analytes from HTLC(High-throughput liquid Chromatography) column on to the ACE C18 (50 mm × 4.6 mm i.d., 5 µm) column and 0.15% aqueous formic acid at 0.2 mL/min in added post column. (4) LC–MS/MS was performed using ballistic gradient at 2.0 mL/min (10–90% acetonitrile in 0.15% formic acid). 345
et al J. Chem. Pharm. Res., 2011, 3(2):341-353 I. Sarath Chandiran ______________________________________________________________________________ 3.2. On-line sample extraction The gradient program accomplished a Cyclone HTLC(High-throughput liquid Chromatography) column for sample extraction, elution with four pumps as reported in Table 2. TLX turbo flow on-line technique was employed for separation of analyte from sample molecules. The mechanism involved in sample preparation may be affinity. The small drug molecules bind to the HTLC(High-throughput liquid Chromatography) column, and molecules that have lower binding affinity quickly diffuse into the column particles and large sample molecules are flushed to waste, then the mobile phase elutes the analyte molecules that are bound at HTLC(High- throughput liquid Chromatography) column to analytical column, from this analytical column analytes are entered to mass detector. To achieve required chromatograms with consistency performed different combinations of the solvents and gradient system. Finally succeeded with the solution combinations as mentioned in Table 2 and analyzed more than 150 samples with out overloading of the chromatographic columns with improved real throughput efficiency. Table 2: Steps involved in on-line robotic method Step Start Sec. Flow Grad %A %B %C %D Tee Loop Flow Grad %A %B 1 2 3 4 5 6 7 0.0 0.5 1.0 1.5 2.0 2.5 3.0 30 30 30 30 30 30 30 2.0 1.0 2.0 2.0 2.0 2.0 2.0 Step Step Step Step Step Step Step 100.0 0.0 0.0 0.0 50.0 50.0 100.0 0.0 50.0 0.0 0.0 0.0 0.0 0.0 0.0 50.0 0.0 0.0 50.0 50.0 0.0 0.0 0.0 100.0 100.0 0.0 0.0 0.0 - T - - - - - Out In In In In In Out 1.0 1.0 1.0 1.0 1.0 1.0 1.0 Step Step Ramp Step Step Step Step 90 90 90 90 90 90 90 10 10 10 10 10 10 10 3.3. Ion suppression One important factor that can affect the quantitative performance of a mass detector is ion suppression. Sample matrix, coeluting compounds and cross-talk can contribute to this effect. Ionization suppression typically observed in sample extracts from biological samples is not likely to be caused ionization suppression is the result of high concentrations of nonvolatile materials present in the spray with the analyte. The exact mechanism by which the nonvolatile materials inhibit release of analyte into the gas phase has not been clearly demonstrated, although a likely list of effects relating to the attractive force holding the drop together and keeping smaller droplets from forming should account for a large portion of the ionization suppression observed with ESI. Once nonvolatile materials have been removed from sample preparation, there is no guarantee that suppression of ionization will no longer be a problem; other mechanisms such as impairing agents (e.g. trifluoro acetic acid) may play a role in ionization suppression. Bonfiglio et al. [25] reported the effects of sample preparation methods on the variability of ESI response. According to their results precipitation method showed the greatest amount of ESI response suppression followed by solid-phase extraction while liquid–liquid extracts demonstrated the least. In this study robotic liquid handling system was employed for sample extraction from plasma and 0.15% formic acid was employed as mobile phase additive to minimize ion suppression. 346
et al J. Chem. Pharm. Res., 2011, 3(2):341-353 I. Sarath Chandiran ______________________________________________________________________________ 3.4. Assay validation The objective of validation of an analytical procedure is to demonstrate that it is suitable for its intended purpose" (International Conference on Harmonization Guideline Q2A) [26] "Method validation is the process of demonstrating that analytical procedures are suitable for their intended use" (US Food and Drug Administration Draft Guidance for Industry, 2000) [27]. 3.4.1. Specificity and selectivity Six human plasma samples from six individual healthy donors receiving no medication were extracted and analyzed for the assessment of potential interferences with endogenous substances. The apparent responses at the retention time of drug, metabolite and internal standard were compared to the response at the lower limit of quantification (LLOQ) for drug, metabolite and to the response at the working concentration for internal standard. Observed Retention times were about 0.98 min (Carvedilol), 1.04 min (4-Hydroxyphenyl Carvedilol) and 1.24 min (Propranolol) respectively. No additional peak due to endogenous substances that could have interfered with the detection of the compounds of interest was observed. Representative chromatograms from an extract of human blank plasma spiked with internal standard and from an extract of human blank plasma spiked with drug, metabolite and internal standard are shown in Fig.2A and B. (A) 347
et al J. Chem. Pharm. Res., 2011, 3(2):341-353 I. Sarath Chandiran ______________________________________________________________________________ (B) 348
et al J. Chem. Pharm. Res., 2011, 3(2):341-353 I. Sarath Chandiran ______________________________________________________________________________ Fig. 2. (A) Representative Chromatograms from an extract of Human blank plasma spiked with Propranolol as IS. (B) Representative Chromatograms from an extract human blank plasma spiked with Carvedilol, 4- Hydroxyphenyl Carvedilol and Propranolol (as IS) 3.4.2. Linearity Linearity means that the assay provides test results that are proportional to the concentration of the analyte in the sample either directly or via a mathematical transformation. The relationship between the experimental response value and known concentrations of the analyte is referred to as calibration curve. In this study calibration curve was constructed by weighted 1/x2 of the peak area ratio (drug/IS) vs. the concentration of drug and (metabolite/IS) vs. the concentration of metabolite with the above calibration standards to generate a calibration curve. Linear calibration curves were obtained with a coefficient of correlation (r2) usually higher than 0.998. For each calibration standard level, the concentration was back calculated from the linear regression curve equation. The mean accuracy and precisions for back calculated concentrations of each standard calculated from calibration curves are tabulated as Table 3. Table 3.Back calculated concentrations from calibration curves Carvedilol(ng/mL) Nominal Conc. Mean Accuracy (%) 0.1 111.4 3.5 0.7 92.1 4.6 1.6 95.6 9.4 5.8 98.6 5.2 15.0 100.2 6.1 55.0 113.2 3.2 126.0 99.6 5.9 252.0 93.5 5.5 The LLOQ was defined as the lowest concentration in the standard curve that can be measured with acceptable accuracy and precision, and was found to be 0.1 ng/mL for both Carvedilol and 4-Hydroxyphenyl Carvedilol in human plasma. The mean responses for the analytes peaks at the assay sensitivity limit (0.1 ng/mL for both Carvedilol and 4-Hydroxyphenyl Carvedilol) were 4-Hydroxyphenyl Carvedilol (ng/mL) Nominal Conc. Mean Accuracy 0.1 0.7 1.6 5.8 15.0 55.0 126.0 252.0 Precision (%) Precision (%) 1.2 5.4 2.2 5.6 5.9 4.9 5.4 7.7 (%) 94.8 107 89.5 98.2 92.2 100.1 99.8 105.7 349
et al J. Chem. Pharm. Res., 2011, 3(2):341-353 I. Sarath Chandiran ______________________________________________________________________________ ten-fold greater than the mean responses for the peaks in blank human plasma samples at the retention times of the analytes, respectively. 3.4.3. Recovery Recovery experiments should be performed by comparing the analytical results for extracted samples at three concentrations with unextracted standards that represent 100% recovery. Recovery of the analyte need not be 100% but the extent of recovery of an analyte and an internal standard should be consistent, precise and reproducible. The recoveries of Carvedilol, 4- Hydroxyphenyl Carvedilol and Propranolol were evaluated with 6 replicates at 3 different concentration levels. In this method 89%, 85% and 94% recoveries were established for Carvedilol, 4-Hydroxyphenyl Carvedilol and Propranolol respectively, which were within the acceptance criteria. 3.4.4. Precision and accuracy Intra-day accuracy and precision were evaluated by analysis of quality control samples at 4 different levels (n=6 at each level) on the same day. These levels were chosen to demonstrate the performance of the method and to determine the lower limit of quantification of the method. The upper limit of quantification was given by the highest level of the calibration curve. Samples with concentration above this upper limit of quantification should be diluted prior to reanalysis. To assure the interday accuracy and precision, the intraday assays were repeated on 3 different days. The overall performance was calculated. The results were found to be quite comfortable as per international guidelines. The accuracy and precision for inter day and intra day are tabulated for both drug and metabolite in Table 4. Table 4.Assessment of Accuracy and precision of the method Carvedilol 200 100 1.25 Intra-day accuracy(%)(day1) 95.5 96.6 95.8 Intra-day precision(%)(day1) 1.2 9.6 2.3 Intra-day accuracy(%)(day2) 101.4 94.2 89.9 Intra-day precision(%)(day2) 3.4 9.5 4.1 Intra-day accuracy(%)(day3) 100.4 99.7 94.8 Intra-day precision(%)(day3) 5.4 3.5 7.5 Overall accuracy (%) 99.1 96.8 93.5 Overall Precision (%) 3.3 7.5 4.6 Number of determinations 18 18 18 3.4.5. Stability According to FDA guidelines stability assessments i.e. freeze–thaw, bench top, short-term, long- term, stock solution and post preparative stabilities were evaluated as a part of bioanalytical method validation. In this study quality control plasma samples were used subject to bench top (12h), in injector (10–85 h), freeze–thaw (-60 to +25 °C) cycles, short term (28 h) at room temperature and long term (35 days) at deep freezer (at -60 °C) tests were performed. The values obtained for these stability studies are tabulated (Table 5), which were within the acceptance criteria. 4-Hydroxyphenyl Carvedilol 200 100 97.8 98.2 9.2 9.7 114.5 94.5 7.6 3.5 107.2 96.2 6.1 3.1 106.2 96.4 7.6 5.4 18 18 Nominal Conc. (ng/mL) 0.5 90.8 4.6 97.9 6.5 113.4 2.3 100.7 4.5 18 1.25 94.1 9.3 89.1 7.5 98.3 2.3 91.6 6.4 18 0.5 89.9 1.8 114.2 3.2 107.8 1.5 102.1 2.2 18 350
et al J. Chem. Pharm. Res., 2011, 3(2):341-353 I. Sarath Chandiran ______________________________________________________________________________ Table 5.Stability results Carvedilol Accuracy HQC LQC 95.0 91.6 102.2 98.8 101.8 97.8 95.4 4-Hydroxyphenyl Carvedilol Accuracy HQC LQC 94.7 97.2 91.8 93.2 99.7 101.2 93.8 105.9 Precision HQC 4.7 2.8 8.5 3.4 Precision HQC 2.2 4.0 7.5 8.3 Experiment LQC 4.3 8.8 6.7 5.3 LQC 1.5 4.7 7.0 2.8 Freeze-thaw stability 110.0 Bench top Stability Auto sampler Stability In injector stability 3.5. Application of the method The method was applied for a randomized, open labelled, balanced, single dose, two treatment, two period, two sequence, two way crossover bioequivalence study with at least one week washout period to compare Carvedilol phosphate 40mg controlled Release capsules (Test formulation) with COREG CRTM containing Carvedilol phosphate 40mg extended release capsules (Reference formulation) in 18 healthy, adult, human male volunteers under fasting conditions. Table 6.Pharmacokinetic parameters of Carvedilol & 4-Hydroxyphenyl Carvedilol Carvedilol Formulation Pk Parameters Test Reference Cmax (ng/mL) 32.421 37.821 4-Hydroxy phenyl Carvedilol Test 5.845 Reference 6.494 AUCt (ng.h/mL) 239.95 248.616 39.872 43.44 AUCinf (ng.h/mL) 272.713 266.912 47.440 66.141 Tmax (hr) 5.173 5.049 5.136 5.073 kel (1/h) 0.125 0.143 0.097 0.093 t1/2 (hr) 5.857 5.348 7.326 9.146 351
et al J. Chem. Pharm. Res., 2011, 3(2):341-353 I. Sarath Chandiran ______________________________________________________________________________ Fig.3. (A) Mean plasma concentration – time profiles of Carvedilol. (B) Mean plasma concentration – time profiles of 4-Hydroxyphenyl Carvedilol. After single oral administration of the drug with 240±02 mL of drinking water, 23 blood samples were collected at a suitable time intervals up to 50 hours. This method was successfully used to measure the Plasma concentrations of Carvedilol and 4-Hydroxyphenyl Carvedilol. Various Pharmacokinetic parameters established and compared for the both of the preparations are given in Table 6. Plasma concentration- time profiles are given as graph (Fig. 3A and B). CONCLUSION On-line coupling requires some modifications to the offline extraction techniques. The coupling is most commonly performed with the help of multiport valves and one or more pumps for the dynamic extraction or transfer of the extract to the chromatographic system, the extraction can be performed in either static or dynamic mode or as a combination of these so long as the extraction system allows the on-line transfer of the extract to the chromatographic system. In on-line systems, the whole extract is transferred to the chromatographic column, in contrast to traditional off-line techniques where only a small part is injected. This means that the sensitivity of the on- line method is much better. However, the high sensitivity easily leads to overloading of the analytical column. Miniaturisation of the extraction system is often required to avoid this. In our method miniaturisation is achieved with small extraction in extraction vessels and the total analysis means sample extraction, chromatographic separation and mass spectrometric detection has been completed within 2.5 min for one sample quantification. REFERENCES [1]U. Abshagen, J. Cardiovasc. Pharmacol., 1987, 10, S23. [2]K. Strein, G. Sponer, B. Muller-Beckmann, W. Bartsch, J. Cardiovasc. Pharmacol., S33, 1987, 10. [3]W. Bartsch, G. Sponer, K. Strein, B. Muller-Beckmann, L. Kling, E. Bohm, U. Martin, H.O. Borbe, Eur. J. Clin. Pharmacol.,1990, 38, S104. 352
et al J. Chem. Pharm. Res., 2011, 3(2):341-353 I. Sarath Chandiran ______________________________________________________________________________ [4]G. Sponer, K. Strein, B. Muller-Beckmann, W. Bartsch, J. Cardiovasc. Pharmacol., 1987, 10,S42. [5]R.R. Ruffolo jr., M. Gellai, J.P. Hieble, R.N. Willette, A.J. Nichols, Eur. J. Clin. Pharmacol.,1990, 38, S82. [6]C. de Mey, K. Breithaupt, J. Schloos, G. Neugebauer, D. Palm, G.G. Belz, Clin. Pharmacol. Ther.,1994, 55,329. [7]M.A. Pfeffer, L.W. Stevenson, N. Engl. J. Med.1996, 334, 1396. [8]M. Packer, M.R. Bristow, J.N. Cohn, W.S. Colucci, M.B. Fowler, E.M. Gilbert, N.H. Shusterman, N. Engl. J. Med.,1996, 334,1349. [9]S.A. Fahlbusch, D. Tsikas, C. Mehls, F.M. Gutzki, R.H. Boger, J.C. Frolich, D.O. Stichtenoth, Eur. J. Clin. Pharmacol, 2004, 60, 83. [10]F. Varin, L.X. Cubeddu, J.R. Powell, J. Pharm. Sci.,1986,75,1195. [11]K. Reiff, J. Chromatogr., 1987,413, 355. [12]E.J. Eisenberg, W.R. Patterson, G.C. Kahn, J. Chromatogr., 1989, 493, 105. [13]H. Spahn, W. Henke, P. Langguth, J. Schloos, E. Mutschler, Arch. Pharm. (Weinheim).1990, 323,465. [14]G. Neugebauer, W. Akpan, B. Kaufmann, K. Reiff, Eur. J. Clin. Pharmacol.1990, 38,108. [15]N. Hokama, N. Hobara, H. Kameya, S. Ohshiro, M. Sakanashi, J. Chromatogr. B. 732,1999, 233. [16]D. Tenero, S. Boike, D. Boyle, B. Ilson, H.F. Fesniak, S. Brozena, D. Jorkasky, J. Clin. Pharmacol. 40, 2000, 844. [17]P. Ptacek, J. Macek, J. Klima, J. Chromatogr. B. 789, 2003, 405. [18]L. Clohs, K.M. McErlane, J. Pharm. Biomed. Anal. 31, 2003, 407. [19]J. Oravcova, D. Sojkova, W. Lindner, J. Chromatogr B. 682, 1996, 349. [20]F. Behn, S. Laer, H. Scholz, J. Chromatogr. Sci. 39, 2001, 121. [21]M. Machida, M. Watanabe, S. Takechi, S. Kakinoki, A. Nomura, J. Chromatogr. B. 789, 2003, 187. [22]W.H. Schaefer, J. Politowski, B. Hwang, F. Dixon Jr., A. Goalwin,L. Gutzait, K. Anderson, C. DeBrosse, M. Bean, G.R. Rhodes, Drug Metab. Dispos. 26, 1998, 958. [23]M. Gergov, J.N. Robson, E. Duchoslav, I. Ojanpera, J. Mass Spectrom. 35, 2000, 912. [24]J.L. Herman, Rapid Commun. Mass Spectrom. 16, 2002, 421. [25]R. Bonfiglio, R.C. King, T.V. Olah, K. Merkle, Rapid Commun. Mass Spectrom. 13, 1999, 1175. [26] International Conference on Harmonization Guideline Q2A, Validation of Analytical Procedures. Guideline for Industry. US Food and Drug Administration. [27]Guidance for Industry: Analytical Procedures and Methods Validation: Chemistry, Manufacturing, and Controls Documentation; Draft Guidance. Rockville, MD: US FDA; 2000. 353