Download
1 / 24
240 likes | 249 Views
Heavy metals concentrations in water and sediment samples collected from five streams in<br>Tarkwa gold mining district of Ghana were studied. The water and sediment samples were<br>analysed for As, Al, Cd, Co, Cu, Hg, Mn, Sb, Th, and V, using Instrumental Neutron Activation<br>Analysis (INAA). The results of this study generally showed elevated levels of all the ten<br>examined elements in the water and sediment samples. Angonabeng and Bediabewu rivers<br>recorded high levels of Sb, Mn, Cu, Al, Co, Hg and As in their water samples. The<br>Contamination Factor (CF) results revealed that Teberebie springs are mainly polluted with Sb,<br>Mn V, Al and Cd; and Mile 7 spring sediment is mainly polluted with Sb. Teberebie spring is<br>heavily affected by anthropogenic and natural sources of the ten examined metals according to<br>its Pollution Load Index (PLI). The water-sediment correlation matrix, Pollution Load Index<br>(PLI) and the Contamination degree (Cd) results from this study have revealed that the<br>concentrations of the examined metals in the water column depend on the amount in the sediments, and are directly proportional. <br>

E N D
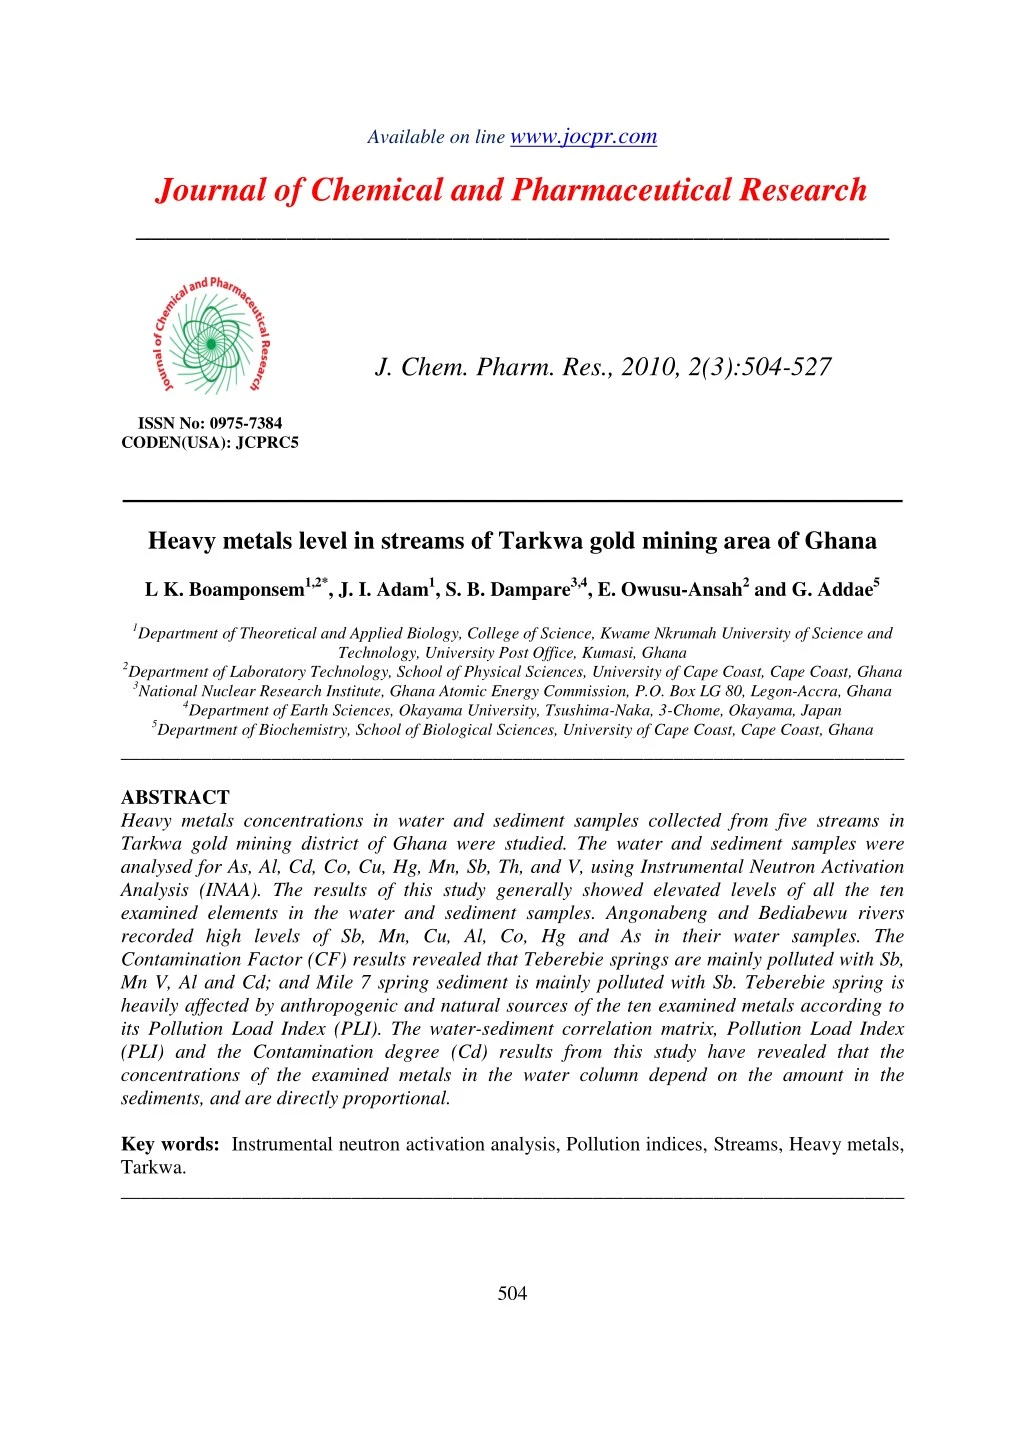
Available on line www.jocpr.com Journal of Chemical and Pharmaceutical Research __________________________________________________ J. Chem. Pharm. Res., 2010, 2(3):504-527 ISSN No: 0975-7384 CODEN(USA): JCPRC5 Heavy metals level in streams of Tarkwa gold mining area of Ghana L K. Boamponsem1,2*, J. I. Adam1, S. B. Dampare3,4, E. Owusu-Ansah2 and G.Addae5 1Department of Theoreticaland Applied Biology, College of Science, Kwame Nkrumah University of Science and Technology, University Post Office, Kumasi, Ghana 2Department of Laboratory Technology, School of Physical Sciences, University of Cape Coast, Cape Coast, Ghana 3National Nuclear Research Institute, Ghana Atomic Energy Commission, P.O. Box LG 80, Legon-Accra, Ghana 4Department of Earth Sciences, Okayama University, Tsushima-Naka, 3-Chome, Okayama, Japan 5Department of Biochemistry, School of Biological Sciences, University of Cape Coast, Cape Coast, Ghana ______________________________________________________________________________ ABSTRACT Heavy metals concentrations in water and sediment samples collected from five streams in Tarkwa gold mining district of Ghana were studied. The water and sediment samples were analysed for As, Al, Cd, Co, Cu, Hg, Mn, Sb, Th, and V, using Instrumental Neutron Activation Analysis (INAA). The results of this study generally showed elevated levels of all the ten examined elements in the water and sediment samples. Angonabeng and Bediabewu rivers recorded high levels of Sb, Mn, Cu, Al, Co, Hg and As in their water samples. The Contamination Factor (CF) results revealed that Teberebie springs are mainly polluted with Sb, Mn V, Al and Cd; and Mile 7 spring sediment is mainly polluted with Sb. Teberebie spring is heavily affected by anthropogenic and natural sources of the ten examined metals according to its Pollution Load Index (PLI). The water-sediment correlation matrix, Pollution Load Index (PLI) and the Contamination degree (Cd) results from this study have revealed that the concentrations of the examined metals in the water column depend on the amount in the sediments, and are directly proportional. Key words: Instrumental neutron activation analysis, Pollution indices, Streams, Heavy metals, Tarkwa. ______________________________________________________________________________ 504
L K. Boamponsemet al J. Chem. Pharm. Res., 2010, 2(3):504-527 _____________________________________________________________________________ INTRODUCTION Gold mining has contributed immensely to the economy of Ghana [1-3]. In spite of the socio- economic benefits of gold mining to the local communities and the country as a whole, a considerable stress has been put on the environment and basic life support systems, thus posing potential threat to the health of the people [4]. Mining and industrial processing are among the main sources of heavy metal contamination in the environment [5]. Mining activities, through milling operations coupled with grinding, concentrating ores and disposal of tailings, along with mill wastewater provide obvious sources of heavy metal contamination of the environment [6-8]. It is, therefore, not surprising that the degree and extent of heavy-metal pollution as a result of human activities has been one of the main topics studied in environmental geochemistry [6]. Heavy metals can cause health problems at higher exposures and destroy aquatic organisms when leached into water bodies. Metals contamination in aquatic environments has received huge concern due to their toxicity, abundance and persistence in the environment, and subsequent accumulation in the aquatic habitats. Heavy metal residues in contaminated habitats may accumulate in microorganisms, aquatic flora and fauna, which in turn may enter the human food chain and result in health problems [9]. Some of the gold bearing ores in Ghana are known to be pyrites (FeS) and arsenopyrites (FeSAs) [4, 10]. During the processing of the ores for the gold, poisonous substances such as oxides and sulphides of heavy metal pollutants are released into the environment. Other heavy metals associated with the gold, such as arsenic (As), cadmium (Cd), lead (Pb), zinc (Zn) and copper (Cu) may be freed to enter streams. Mercury (Hg) may also enter streams if miners use it to recover fine particles of gold. Most gold ore processing relies on cyanide leaching to extract gold from the ore. The gold-bearing cyanide solution is then concentrated, and the gold is recovered and further purified [11]. Occasionally, cyanide and its associated heavy metals are released accidentally or deliberately into the environment posing short and long term effects to living organisms. For instance, villages in the Wassa West District of the Western Region of Ghana were hit by the spillage of thousands of cubic metres of mine wastewater contaminated with cyanide and heavy metals. The cyanide-laced waste contaminated the Asuman river on October 16, 2001 when a tailings dam ruptured during a mine operation. Many dead fishes, crabs and birds were seen littering the banks of the river; others floated on the surface of the river which is the only source of drinking water for Abekoase, Huni and surrounding villages. Scientists were apprehensive that the cyanide and heavy metal residue from the spill could remain for decades thereby posing health and environmental threat to the people and wildlife in the area [12]. The geochemical investigation of sediments is of major importance in the study of aquatic systems, as they provide information about the heavy metals dissolved [13]. The sediment of any water body contains a historical record of the natural and anthropogenic fluxes of heavy metals received into the water basin [14, 15]. Studies by Das [13], Aksoy et al. [16] and Nguyen et al. [17] proved that sediment samples can be used to study the heavy metal (including mercury, vanadium and arsenic) levels in water bodies. In Ghana, some studies have been conducted on heavy metal pollution in streams of some mining towns e.g.,[ 8,18, 19]. The need to assess the quality of water bodies and their sediments in terms of their metallic load in all the mining areas of Ghana becomes imperative since water from these sources is being 505
L K. Boamponsemet al J. Chem. Pharm. Res., 2010, 2(3):504-527 _____________________________________________________________________________ used for drinking, domestic irrigation and livestock activities by people living in the catchment areas, in view of the health implications that cut across the food strata. Most studies on heavy metal pollution in Ghana have concentrated on other mining areas such as Obuasi and Prestea e.g.,[4, 18, 19]. Only limited literature is available on heavy metal pollution in the Tarkwa gold-mining district of Ghana [20]. Several years of large scale and small scale mining activities in the Tarkwa vicinity are a potential source of environmental pollution. However, knowledge of metals concentration in streams of this mining district is fairly limited. Background levels of heavy metals, toxicity and transport of trace elements in streams are important in policy decisions regarding the operations of mines and application of agrochemicals. This study assessed the level of heavy metals in five streams located at Mile 7 and Teberebie in the Tarkwa gold mining district of Ghana using instrumental neutron actication analysis (INAA) and pollution indices. It was aimed at providing information on the concentrations of ten elements (Sb, Mn, Cu, V, Al, Co, Hg, As, Cd and Th) in streams of mining communities thereby contributing to development of database of heavy metals in the geologic environment of Ghana. EXPERIMENTAL SECTION 2.1. Study area Teberebie and Miles 7 are part of the Wassa West District in the Western Region with Tarkwa as the capital. The district lies between latitudes 40 N and 50 40” N and longitudes 10 45”W and 2 010” W. It is bordered to the north by the Wassa Amenfi District, to the south by the Mpohor- Wassa East and Ahanta West, to the east by the Mpohor-Wassa East and to the west by the Nzema East District. Teberebie, Miles 6, 7 and 8 are part of the Tarkwa mining lease lands and falls within the southwestern equatorial climate zone, where the seasons are primarily regulated by moist southwestern monsoon winds from the South Atlantic Ocean and dry, laden northeast trade winds, which blow over the Sahara desert from the northern subtropical high pressure zone. There are two main rainfall periods: April through June and September through November, with a mean rainfall of 1926mm. The abundance of rainfall and moderate temperatures in the area are conducive to dense vegetation growth. Relative humidity for the area does not vary remarkably throughout the year, ranging from 70% to 90%. The mean monthly temperatures are within the range of 24-280C. The lowest temperatures recorded for the area occur during July and August due to extensive cloud cover, while the highest monthly temperatures are usually recorded during February and March, when cloud cover is sparse [21]. The vegetation of the area consists of tropical rain forest characterized by rich undergrowth of climbers and shrubs of varying heights. The trees, which generally reach heights of between 15 and 45 metres, are distributed mostly at the summit of hills where mining has not yet reached. There has been a rapid reduction in the density of trees in areas affected by mining activities. Where the area has been mined out, the vegetation consists of ferns and other shrubs which grow profusely on the hilly slopes. 506
L K. Boamponsemet al J. Chem. Pharm. Res., 2010, 2(3):504-527 _____________________________________________________________________________ The topography of the study area is characterized by ragged ridges with peaks reaching a height in some areas 335 metres above mean sea level, interspersed by undulating valley bottoms. Teberebie and its environs have evergreen mountain ranges which are rich in biodiversity. The two main large scale mines in the study area are Teberebie Goldfields Limited (TGL) which has been operating since 1990 and Iduapriem Anglogold Ashanti Mines (IAAM) which has also been operating since 1992 [22] . 2.2. Sampling and sample preparation Soil samples were collected from ten sampling points during September 2008–January 2009. Samples were collected once every month from all designated sampling points. Table 1 gives the sampling points, sample descriptions and locations. Water and sediment samples from Kakum river (Cape Coast), which has no record of pollution and sprang through non mining towns and communities in the central region of Ghana were taken and analyzed to serve as a reference Sediments and water samples were collected from two rivers and three springs during September 2008–January 2009. Samples were collected once every month from all designated sampling points in Teberebie and Mile 7. Water samples of rivers and springs were taken from all sampling sites. River water samples were collected from downstream and downslope. The collection of water samples of the river and springs was performed wearing polyethylene gloves, and facing the direction of flow of the stream [18]. Pre-cleaned polyethylene 1litre sampling bottles were used for sampling. At each sampling point, the bottles were rinsed 3 times with the water before collection of the sample. Each bottle was immersed at about 8cm below the water surface. The water samples were acidified with 50% HNO3 acid solution to achieve a pH of 2.0. The addition of acid to water sample is to keep the metal ions in the dissolved state, as well as to prevent microbial activities [18]. The samples were then kept in an ice chest loaded with ice block, transported to the laboratory and stored in a refrigerator until analysis. At the INAA laboratory, 0.5ml of each water sample was pipetted using calibrated Eppendorf tip ejector pipette into clean pre-weighed 1.5ml polyethylene capsules, weighed and sealed. Two of these sample vials were placed into a 7.0ml polyethylene capsule and heat-sealed for medium irradiations. For short irradiations, only one of these sample vials was placed into a 7.0ml polyethylene capsule and loaded with cotton wool, and heat-sealed. Sediments were collected from all sampling sites as the water samples. Sediment samples at a depth of about 10cm from the surface were collected with a pre-cleaned polyethylene shovel [18]. The polyethylene shovel was used to scoop the sediment. The sediment samples were transferred into a pre-cleaned polyethylene bags. They were then transported to the laboratory. At the laboratory, each sediment sample was dried at room temperature for 3 days. Using polyethylene gloves, organic debris and other unwanted large particles were hand picked from each sample. The dried samples were then sieved using 2mm sieve and homogenized. 0.1g of each sediment sample was weighed onto polyethylene film, wrapped and heat-sealed. Six replicate sub-samples were prepared for each sample, packed into polyethylene irradiation vial 507
L K. Boamponsemet al J. Chem. Pharm. Res., 2010, 2(3):504-527 _____________________________________________________________________________ and heat-sealed. The accuracy of the analytical method was evaluated using the standard reference material (SRM) IAEA-405 (Trace elements and methylmercury in estuarine sediment) obtained from International Atomic Energy Agency (IAEA). Six replicates of the SRM were prepared and packaged in a similar manner as the sediment samples. 2.3. Sample irradiation and counting The samples and standards were irradiated using Ghana Research Reactor-1 (GHARR-1) facility at National Nuclear Research Institute laboratory of GAEC. GHARR-1 reactor (miniature neutron source) operated at power rating of 15kW with a thermal neutron flux of 5.0 x 10¹¹ns- 1cm-2. By means of pneumatic transfer systems which operated at a pressure of 1.723bar, the samples were transferred into the inner irradiation sites. The scheme for irradiation was chosen according to the half-lives of the elements of interest [4; 6]. The sediment samples were short and medium irradiated for 10s and 1hr respectively. The water samples were irradiated for 120s and 1hr for short and medium irradiations, respectively. At the end of each irradiation, the samples were returned from the reactor and allowed to cool down until the level of activity was within the acceptable limit for handling. The irradiated samples were placed on top of the detector and counts were accumulated for pre-selected time to obtain the spectra intensities. For short and medium irradiations, 10 minutes counting time was chosen [4, 6]. The qualitative and quantitative measurements of elements in samples were performed using a PC-based gamma ray spectroscopy consisting of n-type high purity germanium (HPGe) detector model GR 2518 (Canberra industries Inc.), HV power supply model 3103, amplifier model 2020, an 8K Ortec multi-channel buffer (MCB) emulation software card and a Pentium II computer for spectrum and data evaluation and analysis. The detector had a relative efficiency of 25% to NaI detector and operated on a bias voltage of (–ve) 3000V with a resolution of 1.8keV for 60Co gamma-ray energy of 1332keV. The MCB card was used to obtain the spectra intensities of the samples. A Microsoft window based software MAESTRO was used to for spectrum analysis (i.e., qualitative and quantitative analyses). The analytical photopeaks used for the determination of the various elements in this study have been summarized in Table 1a. Table 1a. Nuclear data of the elements used in NAA analysis Source: [6, 23, 24]. 508
L K. Boamponsemet al J. Chem. Pharm. Res., 2010, 2(3):504-527 _____________________________________________________________________________ 2.4. Statistical analysis The pollution Load Index (PLI), Geoaccumulation Index (Igeo), Enrichment Factor (EF) and contamination degree (Cd) were computed using Microsoft Excel 2007. The mean elemental concentrations and standard deviations for the water and sediment data were determined using SPSS version 16 software. Correlation matrices for the streams were constructed using Spearman’s Rho method of the SPSS version 16 software. 2.5. Quantification of streams pollution The amount of metal contamination in the examined samples was quantified using geoaccumulation index (Igeo,), pollution load index (PLI), enrichment factor (EF) and Contamination degree (Cd). The overall water and sediment quality of the streams was determined using the PLI method. A brief description of the applied indices is given below: 2.5.1.Geoaccumulation index (Igeo) The Geoaccumulation index for the monitored metals in the sediment samples in each sampling point was calculated using the equation: ???? ?log?Cn 1.5?Bn? Where Cn is the concentration of metals monitored in sediment samples and Bn is the geochemical background concentration of the metal (n) in the world average shale [25, 28. Factor 1.5 is the background matrix correction factor due to lithospheric effects. The geoaccumulation index consists of seven grades or classes [25, 26-29] [Table 1b]. Class 7 is an open class and comprises all values of the index higher than class 6. The elemental concentrations in class 7 may be hundredfold greater than the geochemical background value [7, 27, 29-31]. Table 1b. The seven classes of Geoaccumulation index values 2.5.2.Contamination factor (CF) and Pollution Load Index (PLI) The CF is the ratio obtained by dividing the concentration of each metal in the sediment or water sample by the baseline or background value (concentration in unpolluted soil): Concentration of metal in sample Concentration of metal in background ?? ? 509
L K. Boamponsemet al J. Chem. Pharm. Res., 2010, 2(3):504-527 _____________________________________________________________________________ The contamination levels may be classified based on their intensities on a scale ranging from 1 to 6 (0= none, 1= none to medium, 2= moderate, 3= moderately to strong, 4= strongly polluted, 5=strong to very strong, 6=very strong) [31, 32]. The CF value of 6 indicates that the metal concentration is 100 times greater than what would be expected in the world average shale as reported by Turakian and Wedepohl [33]. According to Tomlinson et al. 1980, pollution load index (PLI) is an empirical index which provides a simple, comparative means for assessing the level of heavy metal pollution. Pollution load index was therefore used to find out the mutual pollution effect of the studied metals on each of the sampling sites. The PLI values were calculated as the nth root of the product of the n CF [24; 30, 34]: ??? ? √??1???2???3?…???? 2.5.3.Contamination degree (Cd) of Stream water samples To assess the excessive values of monitored elements in water samples Teng et al. [7] approach was followed using the equation: Cd = ∑Cfi , where Cd is the contamination degree, and Cfi is the contamination factor for the i-th element, Cfi = (Cn/Cb)-1, where, Cn is the analytical value of the i-th element, and Cb is the upper permissible limit of element in water. In this study, the WHO [35] guideline values for drinking water quality was selected for the calculation of contamination degrees of the streams. 2.5.4.Enrichment factor (EF) The Enrichment Factor (EF) in stream sediments was computed for each element using the equation; ??Cn CAl??sample ??Cn CAl??shale Where (Cn/CAl) sample is the ratio of the concentration of the element of concern (Cn) to that of Al (CAl) in the sediment sample and (Cn/CAl) shale is the same ratio in an unpolluted reference sample [28, 36]. RESULTS 3.1. Chemical analysis The accuracy and precision of the analytical technique (INAA) were assessed by simultaneous activation of reference material IAEA-405 (Estuarine sediment). Table 2 shows the analytical results obtained at GHARR-1 laboratory for the reference material compared with recommended ? ?? ? 510
L K. Boamponsemet al J. Chem. Pharm. Res., 2010, 2(3):504-527 _____________________________________________________________________________ values. The values compare favourably well with the recommended values for Sb, Mn, Cu, V, Al, Hg, Cd, Co, As and Th with bias less than 6%. The precision was calculated as a percentage relative standard deviation (%RSD) of six replicate samples of the prepared standard, and was found to be less than 5%. Table 2. Analytical results (ppm) of Standard Reference Material, IAEA-405 (Estuarine sediment), showing local laboratory values and recommended values Analyte This work Recommended Value 1.81 495 47.7 95 77900 13.7 0.81 23.6 0.73 14.3 95% Confidence interval 1.62–2.00 484–506 46.5–48.9 90–100 72700–83100 13.0–14.4 0.77–0.85 22.9–24.3 0.68–0.78 12.2–16.4 Sb Mn Cu V Al Co Hg As Cd Th 1.73±0.02 498±2.1 47.7±0.11 91.2±0.87 75641±25.1 13.9±0.03 0.79±0.02 23.1±0.15 0.7±0.01 16.01±0.2 3.2. Heavy metals level in rivers The mean concentrations of the ten monitored heavy metals (Sb, Mn, Cu, V, Al, Co, Hg, As, Cd and Th) in Angonabeng, Bediabewu and Kakum river water and sediment samples are reported in Table 3. Table 3: Average values (ppm) of heavy metals in river water and sediment samples Angonabeng River Sediment Sb 38.9 ± 29.1 Mn 36468 ± 47165 Cu 13.0 ± 4.40 V 133 ± 35.6 Al 86423 ± 126042 Co 2.09 ± 0.116 Hg 0.212 ± 0.149 As 5.41 ± 5.95 Cd 0.658 ± 0.584 Th 1.64 ± 0.783 ND implies not detected Bediabewu River Sediment 309±509 365±407 20.1±17.3 417±637 172274±180616 20.0±17.0 0.054±0.038 13.4±10.4 0.312±0.263 15.72±13.2 Kakum River Sediment 3.23 ± 4.79 777 ± 1361 3.21 ± 3.93 30.6 ± 19.0 15836 ± 23802 1.450 ±0.760 5.17 ± 3.68 ND 1.31 ± 0.732 ND 12.9±4.41 Water 41.4 ± 13.9 17.8 ± 27.2 3.66 ± 1.11 0.37 0± 0.240 13.8 ± 9.39 4.09 ± 3.36 1.48 ± 0.256 12.2 ± 7.02 1.11 ± 0.361 0.286 ± 0.18 Water 10.7 ± 10.4 8.04 ± 7.56 5.59 ± 2.58 0.378 ± 0.420 14.6 ± 1.45 2.30 ± 1.37 0.522 ± 0.51 18.4 ± 2.54 1.11 ± 0.080 0.198 ± 0.145 Water ND 0.760 ± 0.710 ND 0.120 ± 0.020 0.064 ± 0.020 ND 0.010 ± 0.010 ND ND 511
L K. Boamponsemet al J. Chem. Pharm. Res., 2010, 2(3):504-527 _____________________________________________________________________________ Generally, the concentrations of the elements in the river sediments were higher than that of the water samples. For the water samples, Angonabeng river recorded the highest average Sb concentration of 41.44ppm while Bediabewu river registered 10.7ppm. The Sb, Cu, Hg, Cd and Th concentrations in the reference river (Kakum) water samples were all below the detection limits. However, Bediabewu river sediment recorded the highest deposits of Sb (308.9ppm). The average Sb concentration in Angonabeng river sediment was 38.9ppm. The reference river sediment recorded Sb concentration of 3.23ppm. The average Mn concentrations in the water samples of Angonabeng, Bediabewu and Kakum rivers were 17.8ppm, 8.04ppm and 0.76ppm, respectively. Angonabeng river recorded the highest Mn concentration of 36468ppm in sediment samples. Mn concentrations of 365 and 777ppm were reported for Bediabewu and Kakum river sediment samples respectively. Bediabewu river registered the highest Cu levels in both water and sediment samples. Average Cu levels in water samples of 5.6ppm and 3.7ppm were reported for Bediabewu and Angonabeng rivers respectively. Bediabewu and Angonabeng recorded V levels of 0.37 and 0.38ppm respectively in water samples whereas 0.12ppm was reported for Kakum river water samples. Bediabewu recorded the highest (417ppm) level of V in sediment samples. Angonabeng and Kakum had average V concentrations of 133.24ppm and 30.62ppm respectively. The average Al concentration (86423ppm) in sediment samples of Angonabeng river was the highest and Bediabewu river was next with 172274ppm whereas Kakum river recorded the lowest of 15836ppm. Average Al levels in water samples of Bediabewu river was highest (14.6ppm), followed by Angonabeng river (13.78ppm) and Kakum river recording the lowest level of 1.45ppm. The average Co concentration in water samples of Angonabeng river (4.1ppm) was almost twice of that recorded for Bediabewu river (2.3ppm) water samples. Kakum river recorded the lowest Co level in water (0.064ppm). However, Bediabewu river sediment samples registered the highest (20.02ppm) deposits of Co. The Co concentrations in Angonabeng and Kakum river sediments were 2.1ppm and 5.17 ppm, respectively. The Hg and Cd levels in Kakum river sediments were less than the detection limits. However, Angonabeng river water had the highest amount of Hg of 1.484ppm while Bediabewu recorded average Hg level of 0.522ppm. The average Hg deposits in the sediment samples of Bediabewu river was 0.054ppm and that of Angonabeng river was 0.212ppm. Bediabewu river had the highest (18.4ppm) amount of As in the water samples followed by Angonabeng river (12.2ppm) with Kakum river having the least value of 0.01ppm. Generally, the level of As in sediment samples was lower than that of the water samples with Bediabewu river recording 13.4ppm whereas Angonabeng river had 5.41ppm and Kakum with 1.31. The average Cd concentrations in Angonabeng and Bediabewu river water samples were almost the same for the two rivers (1.114 and 1.112ppm respectively). Average Cd concentrations in sediment samples were relatively lower than that found in water. Angonabeng river had average Cd level (0.658ppm) in sediments which was almost twice that of Bediabewu river (0.312ppm). The average Th concentration in Bediabewu river sediment was the highest (15.72ppm) followed by Kakum river (12.91ppm) with Angonabeng river having the least value of 1.636ppm. 512
L K. Boamponsemet al J. Chem. Pharm. Res., 2010, 2(3):504-527 _____________________________________________________________________________ However, the Angonabeng river water registered the highest (0.286ppm) level of Th in water samples while Bediabewu river water recorded an average concentration of 0.198ppm. 3.2.1. Relationships of the elements in riverine water and sediment samples The correlation matrix (Table 4) of the elements in the two rivers of the study area demonstrates good inter-relationships between Sb, Mn, Cu, V, Al, Co, Hg, As, Cd and Th. Table 4: Correlation matrix of levels of heavy metals in riverine sediment and water samples There are strong positive correlation coefficients between the elements in river sediments as follows: Sb-Cu (0.806), Sb-V (0.891), Cu-V (0.83), Sb-Al (0.693), Al-V (0.565), Sb-Co (0.552), Al-Co (0.79), Hg-Mn (0.571), Sb-As (0.842), As-Cu (0.697), As-V (0.806), As-Al (0.717), As- Co (0.818), Mn-Cd (0.705), V-Cd (0.62), Hg-Cd (0.668), Sb-Th (0.855), V-Th (0.758), Al-Th (0.809), Co-Th (0.879) and As-Th (0.915). The elemental associations in river sediments yielded moderate to strong positive correlations for Sb-Al-V-Co-As-Th and Sb-Mn-V-As-Cu-Hg-Cd groups. Elements in river water samples showed strong positive correlation coefficients between themselves as follows: Sb-Mn (0.558), Mn-Cu (0.648), Sb-V (0.758), Mn-V (0.867), Mn-Al (0.77), Sb-Co (0.733), Mn-Co (0.818), V-Co (0.842), Sb-Hg (0.863), As-Mn (0.745), As-Cu 513
L K. Boamponsemet al J. Chem. Pharm. Res., 2010, 2(3):504-527 _____________________________________________________________________________ (0.806), As-Al (0.782), Mn-Cd (0.748), V-Cd (0.608), Al-Cd (0.827), Co-Cd (0.669), As-Cd (0.62), Sb-Th (0.774), Mn-Th (0.927), V-Th (0.902), Al-Th (0.756), Co-Th (0.787), As-Th (0.591) and Cd-Th (0.755) . In general, there existed moderate to strong positive correlations within the elements in the two groups of elements below: Sb-Mn-V-Co-As-Hg-Cd-Th, and Sb-Mn-Cu-V-Al-Co-As-Cd-Th The correlation coefficients between river water - sediment relationship (Table 5) showed strong positive correlations for 70% of the examined elements (Mn, Cu, V, Al, Hg, As and Cd ). Sb, Co and Th, however, showed weak positive correlations in the water-sediment relationship. Table 5: Spearman’s correlation for water-sediment 3.3.Heavy metals level in springs 3.3.1.Concentrations of heavy metals in spring water and sediments samples The mean concentrations of the ten examined elements (Sb, Mn, Cu, V, Al, Co, Hg, As, Cd and Th) in water and sediment samples from three springs (one from Mile 7 and two from Teberebie) are presented in Table 6. For the spring water samples, Teberebie springs (2 and 3) recorded a higher average Sb concentration of 8.38ppm and 9.43ppm, respectively while the Mile 7 spring registered 3.69ppm. The spring sediment samples from Teberebie registered higher average deposits of Sb (20.97–33.6ppm). The average Sb concentration in Mile 7 spring sediment samples was 5.29ppm. Teberebie spring 3 water samples had the highest Mn concentration of 21.2ppm and the lowest (6.25ppm) was recorded at Mile 7 spring sediment. The Mn concentration in Teberebie spring 3 was the highest (117770ppm) and Mile 7 spring sediment samples had the least average level of 55.9ppm. Mile 7 spring water samples had the highest average Cu concentration of 4.65ppm, the two Teberebie springs had the least average concentration of between 0.35 and 0.514ppm. Average concentrations of Cu in spring sediments were 2.92ppm, 2.08ppm and 29.9ppm for Mile 7 spring, Teberebie spring 2 and 3 respectively. The average V concentrations in both Mile 7 and Teberebie spring water samples were all less than 1ppm, and were found to be in the range of 0.166 and 0.632ppm. However, there were high 514
L K. Boamponsemet al J. Chem. Pharm. Res., 2010, 2(3):504-527 _____________________________________________________________________________ deposits of V in the sediments of all the springs. Teberebie spring 3 sediments had the highest average V concentration of 1201ppm and Mile 7 spring recorded the least concentration of 58.8ppm. Table 6: Average values (ppm) of heavy metals in springs of Mile 7 and Teberebie The results revealed high amount of Al in Teberebie springs. Teberebie spring 3 water and sediment samples recorded the highest Al concentrations of 27.3 and 142260ppm, respectively whereas Mile 7 spring water and sediment samples registered the lowest levels of 17.6 and 8474ppm, respectively. The result revealed that even though Teberebie spring sediments recorded a higher average concentration of Co (5.15–143ppm), they had the least Co concentrations in water (0.498– 0.584ppm). Mile 7 spring sediment and water samples recorded average Co concentrations of 5.154 and 14.42ppm, respectively. The Hg and Cd were not detected in both water and sediment samples from Mile 7 spring. However, Teberebie spring 2 water and sediment samples recorded average Hg concentrations of 0.014ppm and 0.06ppm, respectively. No Hg was detected in Teberebie spring 3 water samples; however, the level in sediment samples was found to be 0.01ppm. The average Cd concentrations in Teberebie springs 2 and 3 water samples were detected to be 0.024 and 0.656ppm, respectively. The amount of Cd levels in Teberebie Springs 2 and 3 sediments were 0.204 and 0.434ppm, respectively. The As concentrations in all spring samples were less than 2ppm. Mile 7, Teberebie springs 2 and 3 recorded average As concentrations in water samples of 0.206, 0.22 and 1.29ppm, respectively, and that of the sediments were 1.65, 1.94 and 1.04ppm, respectively. The average Th concentrations in Mile 7 spring, Teberebie springs 2 and 3 water samples were detected to be 0.15, 1.55 and 2.03ppm, respectively. The highest average Th concentration of 34.1ppm occurred in Teberebie spring 3 sediments whereas Teberebie spring 2 sediment samples had the least average concentration of 16.98ppm. In general, the ranking of elements in spring water samples in terms of concentrations was as follows: Al>Mn>Sb>Co>Cu>Th>As>V>Cd>Hg. The ranking of elements in spring sediment samples with respect to concentrations Al>Mn>V>Co>Th>Sb>Cu>As>Cd>Hg. followed the order as shown below: 515
L K. Boamponsemet al J. Chem. Pharm. Res., 2010, 2(3):504-527 _____________________________________________________________________________ 3.3.2. Elemental relationships in spring water and sediment samples The correlation matrix (Table 7) of the elements in the examined springs of the study area demonstrates good inter-relationships between Sb, Mn, Cu, V, Al, Co, Hg, As, Cd and Th. The strong positive correlation coefficients for the paired elements in spring sediments were as follows: Sb-Mn (0.893), Sb-Cu (0.793), Sb-V (0.900), Cu-V (0.832), Sb-Al (0.893), Al-V (0.971), Sb-Co (0.723), Al-Co (0.805), As-Hg (0.740), Sb-Th (0.811), V-Th (0.739), Al-Th (0.729) and Co-Th (0.741). Mercury showed negative significant correlation with all the elements except Arsenic and Cd showed weak correlations with Sb, Mn, Cu, V, Al, Co and Th. The elemental associations in spring sediments produced two groups showing a moderate to strong significant positive correlations. These groups of elements are Sb-Mn-V-Al-Cu-Co-Cd-Th and Sb-As-Hg-Th. Elements in spring water samples showed strong positive significant correlation coefficients as follows: Sb-Mn (0.899), Mn-Al (0.764), V-Co (0.445), As-Mn (0.717), As-Al (0.667), Cd-Cu (0.669), Al-Cd (0.826), Co-Cd (0.569), As-Cd (0.66), Sb-Th (0.733), Mn-Th (0.77), Al-Th (0.756), and As-Th (0.62). There were significant negative correlation coefficients for the following element pairs; Cu-Mn (-0.462), Th-Cu (-0.655) and Th-Co (-0.729). In general, there was a moderate to strong positive correlations for the following groups of elements: Sb-Mn-Al- As-Hg-Cd-Th and Cu-Co-V. Table 7: Spearman’s correlation for water-sediment in springs of the study area 516
L K. Boamponsemet al J. Chem. Pharm. Res., 2010, 2(3):504-527 _____________________________________________________________________________ Table 8: Correlation matrix of heavy metals in spring sediments and water samples from Mile 7 and Teberebie A Sb Mn Cu V Sb 1 Mn 0.893** 1 Cu 0.793** 0.832** 1 V 0.900** 0.982** 0.832** 1 Al 0.893** 0.961** 0.821** 0.971** Co 0.723** 0.755** 0.863** 0.780** 0.805** Hg -0.182 -.707* -.707* -.727** As 0.089 -0.271 -0.161 -0.229 Cd 0.091 0.43 0.164 0.285 Th 0.811** 0.743** .782** 0.739** 0.729** 0.741** Al Co Hg As Cd Th 1 1 -.701* -0.3 0.261 -.707* -0.23 0.44 1 0.740** -0.058 -0.311 1 -0.06 0.125 1 0.527 1 B Sb Mn Cu V Al Co Hg As Cd Th 1 0.899** -0.404 0.05 0.820** 0.764** -0.356 0.289 0.724** 0.717** 0.667* 0.733** 0.770** -.655** 1 -.462* 0.05 1 0.389 -0.337 0.875** 0.577 0.004 0.669* 1 0.014 0.445* 0.296 0.304 0.483 -0.078 0.701** -.729** 1 -0.436 0.289 -0.33 0 0.667** 0.826** 1 -0.29 -0.11 0.569* 1 .889* -0.304 0.577 1 0.343 0.660* 0.620** 0.171 1 1 *Correlation is significant at the 0.05 level **Correlation is significant at the 0.01 level A, Spring sediment; B, Spring water Table 8 is a correlation matrix of the 10 examined elements in spring water-sediment relationship. The correlation coefficients between spring water and sediment (Table 7) showed strong positive correlations for 40% of the examined elements (Sb, Mn, Al and Th). Vanadium, Hg, and Cd, however, showed weak positive correlations in the water-sediment relationships. Cu, Co, and As concentrations in springs showed negative correlation in the water-sediment relationship. 3.4. Contamination degrees of stream water samples The contamination degrees of the monitored streams are depicted in Fig 4.25. Angonabeng river water column recorded the highest contamination degree value of 9695 for the elements Sb, Mn, Al, Hg, As and Cd. Bediabewu river followed with contamination degree value of 4090. Teberebie spring 3, 2 and Mile 7 spring water registered contamination degree values of 1003, 603 and 779, respectively. 517
L K. Boamponsemet al J. Chem. Pharm. Res., 2010, 2(3):504-527 _____________________________________________________________________________ Generally, the contamination degrees of riverine water were higher than that of springs. Fig. 1: Comparison of contamination degrees of stream water samples 3.5 The CFs and PLIs of the Angonabeng and Bediabewu rivers are shown in Table 9. Table 9: Contamination factors (CFs) and Pollution Load Indices (PLIs) of streams sediments Quantification of stream sediments pollution Sb Mn 0.223 138.6 0.066 42.9 0.429 0.914 Cu 0.046 V Al Co 0.181 5.01 0.181 0.07 0.702 0.272 Hg 0.15 0.025 - 0.53 0.135 - As Cd 0.68 1.45 - 2.19 1.04 - Th 1.42 2.84 1.945 0.136 1.31 0.0001 PLI 0.41 2.1 0.276 1.1 1.43 0.09 Teberebie Spring 2 Teberebie Spring 3 Mile 7 spring 1 Angonabeng River Bediabewu River Kakum river 13.98 22.4 3.53 25.9 205.9 2.15 1.77 9.24 0.451 1.02 3.21 0.236 0.136 1.78 0.11 1.08 2.15 0.197 0.149 0.081 0.127 0.415 1.03 0.03 0.664 0.065 0.289 0.448 0.071 The CFs result shows that all the streams have high levels of Sb in their sediments in the order: Bediabewu river (205.94)> Angonabeng river (25.9)>Teberebie spring 3 (22.4)>Teberebie spring 2 (13.98)>Mile 7 spring (3.53)>Kakum river (2.15). Teberebie spring 3 sediment recorded the highest CF value of 138.6 for Mn whereas Angonabeng river garnered a CF value of 42.9. 518
L K. Boamponsemet al J. Chem. Pharm. Res., 2010, 2(3):504-527 _____________________________________________________________________________ Teberebie spring 2, Mile 7 spring as well as Kakum river registered Mn CF values less than 1.0. The highest CF value (9.24) for V was found at Teberebie spring 3 sediment samples. The CF values of V recorded for Bediabewu river, Teberebie spring 2 and Angonabeng river sediments were 3.2, 1.77 and 1.02, respectively. Mile 7 spring and Kakum river recorded CF values less than 1.0 for V. Bediabewu river had the highest CF value for Al (2.15) and Teberebie spring 3 followed with 1.78. Mile 7 spring and Kakum river recorded CFs for Al less than 1.0. Teberebie spring 3 recorded the highest (5.01) CF value for Co. The rest of the stream sediments recorded CF values less than 1.0 for Co. The highest CF for Cd (2.19) was detected in Angonabeng river. The CF values for Cd for Teberebie spring 3 and Bediabewu river sediments were computed to be 1.45 and 1.04, respectively. Teberebie spring 2 showed Cd CF of 0.68. Apart from Bediabewu river which retained As CF value slightly above 1 (1.03), all the rest of the examined streams had values less than 1.0. Teberebie spring 3 recorded the highest Th CF value of 2.84 , followed by Mile 7 spring (1.945) and Teberebie spring 2 (1.42), respectively. Angonabeng and Kakum rivers had Th CF values less than 1.0 for their sediments. All the streams recorded CF values less than 1.0 for Cu and Hg. The overall Pollution Load Indices for the stream sediments were found to be in the order: Teberebie spring 3 (PLI = 2.1) > Bediabewu river (PLI = 1.43) > Angonabeng river PLI=1.1) > Teberebie spring 2 (PLI = 0.41) > Mile 7 spring1 (0.276) > Kakum river (PLI = 0.09). A comparative diagram of the PLI values in stream sediment samples is presented by Fig.4.26. Fig. 2: Comparison of Sediment Pollution Load Indices The geoaccumulation indices and enrichment factors for the streams are presented in Table 10 and Table 11 respectively. 519
L K. Boamponsemet al J. Chem. Pharm. Res., 2010, 2(3):504-527 _____________________________________________________________________________ Table 10: Geoaccumulation Index (Igeo) of stream sediments Sb Mn V 3.22 -2.75 0.239 3.89 6.53 2.62 -1.88 -4.51 -1.73 4.11 4.84 -0.549 7.1 -1.81 1.1 0.521 -0.71 -2.67 -4.39 Cu -5.02 -1.17 -4.53 -2.38 -1.74 Al Co -3.05 1.74 -2.47 -3.77 -0.51 -2.46 Hg -3.32 -5.91 - -1.5 -3.47 - As -3.33 -4.19 -3.56 -1.85 -0.543 -3.9 Cd -1.14 -0.05 - 0.548 -0.53 - Th Teberebie Spring 2 Teberebie Spring 3 Mile 7 Spring 1 Angonabeng River Bediabewu River Kakum River -3.46 0.245 -3.82 -0.47 0.522 -2.92 -0.08 0.921 0.375 -3.46 -0.195 -0.479 The Igeo values (Table 10) revealed that nearly all the profiles for Cu, Al, Co, As, Hg, Cd and Th fell into class 1 (Table 4.9). The Igeo values for Cu, Co, Hg and As for all the streams are <0, indicating practically unpolluted stream sediments with respect to these metals. The Igeo values for Th for Teberebie spring 3 and Mile 7 spring were >0 but <1 indicating unpolluted to moderately polluted sediments. The Sb Igeo values for the streams varied most, ranging from −1.88 to 7.1. Bediabewu river sediments recorded the highest Sb Igeo value of 7.1 and falling into the category ‘very strongly polluted’ sediment with Sb. Teberebie spring 2 and 3 showed Sb Igeo values of 3.22 and 3.89, respectively. This puts them into Igeo class 5 (strongly polluted) while Angonabeng river had an Igeo value of 4.11 hence classified as strongly to very strongly polluted with respect to Sb concentration. With the exception of Teberebie spring 3 and Angonabeng river, all the rest of the examined streams recorded Igeo <0 for Mn. Teberebie spring 3 and Angonabeng river recorded Mn Igeo of 6.53 and 4.84 respectively. Angonabeng river and Teberebie spring 3 are placed in strongly to very strongly polluted with regards to Mn concentration. Beside Teberebie springs and Bediabewu river, the rest of the streams registered V Igeo of <0. Teberebie spring 3 recorded the highest V Igeo of 2.62 and Bediabewu river had 1.1, pitching these water bodies into Igeo classes 3 and 4, moderately to strongly polluted respectively. Table 11: Enrichment Factors for stream sediments of study area Sb Mn Cu Teberebie spring 2 102.7 1.63 0.339 Teberebie spring 3 12.6 77.9 0.374 Mile 7 spring 1 33.3 0.62 0.612 Angonabeng river 23.9 39.7 0.268 Bediabewu river 95.6 0.199 0.208 All the streams recorded Al Igeo of <0 except Bediabewu river and Teberebie spring 3, which had 0.522 and 0.245 respectively. Therefore all the streams are practically unpolluted whist Bediabewu river and Teberebie spring 2 are unpolluted to moderately polluted with respect to aluminium. With exception of Angonabeng river with Cd Igeo value of 0.5248, all the examined streams had Cd value of less than 0 and therefore classified as practically unpolluted while V Co 0.127 2.82 2.56 0.102 0.499 Hg 1.1 0.014 0 0.491 0.063 As 1.09 0.046 1.2 0.385 0.478 Cd 4.99 0.813 0 2.03 0.483 Th 13.01 5.19 4.27 0.949 1.49 10.39 1.59 18.4 0.123 0.608 520
L K. Boamponsemet al J. Chem. Pharm. Res., 2010, 2(3):504-527 _____________________________________________________________________________ Angonabeng is unpolluted to moderately polluted. The Co Igeo values for all, except Teberebie spring 3, were <0. Teberebie spring 3 sediments was in the Igeo class 3 (moderately polluted) with a value of 1.375. The results showed that all the stream sediments are significantly enriched with Sb with EF range of 12.6–95.63. All the stream sediments with respect to Cu, Co, Hg and As have enrichment factors of less than 3 and can therefore be classified as depleted to minimally enriched with respect to these elements. Mile 7 spring and Bediabewu river, appeared to be significantly enriched with Mn. The highest EF value of 77.9 for Mn was recorded in Teberebie spring 3. Cobalt appeared to be enriched in spring sediments than in riverine sediments. The EF values of Co for Teberebie spring 3, 2 and Mile 7 spring were 2.82, 0.127 and 2.56, respectively. The riverine sediments of the study area recorded EFs less than 1.0 for Co. The spring sediments were significantly enriched in V than rivers. The EF ranges of V for spring and river sediments were 4.27–13.01 (moderately enriched) and 0.94–1.49 (depletion to minimal enrichment), respectively. Thorium was significantly enriched in Mile 7 spring and Teberebie spring 2 sediments with EF values of 18.4 and 10.39, respectively. The rest of the streams recorded EF values less than 3 for Th. All the streams except Teberebie spring 2 were depleted to minimal enrichment with Cd, as revealed by their EF values (<3). Teberebie spring 2 recorded the highest EF value of 4.99, followed by Angonabeng river with 2.03. DISCUSSION 4.1. Elemental concentrations in streams For the water samples, the concentrations of Sb, Mn, Cu, Al, Co, Hg and As for Angonabeng and Bediabewu rivers are in the range of 10.74–41.44ppm, 8.04–17.804ppm, 3.67–5.6ppm, 13.78– 14.64ppm, 2.3–4.1ppm, 0.52–1.11ppm and 12.18–18.59ppm, respectively (Table 3). Mining activities may have probably released extremely high levels of Sb, Mn, Cu, Al, Co, Hg and As into the environment, which were rain washed into these rivers. The relatively high levels of these elements could also be due to anthropogenic inputs, both point and non-point sources. Angonabeng and Bediabewu rivers are few miles away from the processing sites of the two major mines in the study area, and direct and indirect discharge of mine waste may be a contributing factor to the elevated levels of Sb, Mn, Cu, Al, Co, Hg and As in the water samples. These elements may have also entered the waterways through wet and dry deposition from air or through rain. According to Akabzaa and Darimani [22] streams of the study area are actively used by illegal miners (popularly called galamsey operators) for their operations and these two examined rivers may not be exceptions. The high levels of these elements in the riverine water could also be due to the inherent mineralogy of the ores of the study area. The Cd concentrations in the two rivers (Angonabeng and Bediabewu rivers) were almost the same (1.11ppm) and this may be attributed to natural occurrence of this element in the sediments and surrounding soils as well as the water of these rivers. It is also possible that Cd may have been washed into the rivers from agricultural chemicals used by farmers in the study area. This minimal spatial variation in cadmium concentrations in riverine water may be due to the conservative nature of this element in the aquatic system as shown by Karbassi et al. [28]. The 521
L K. Boamponsemet al J. Chem. Pharm. Res., 2010, 2(3):504-527 _____________________________________________________________________________ Sb, Mn, Cu, Al, Hg, As and Cd levels in Angonabeng and Bediabewu river water samples exceeded the WHO [35] maximum allowable concentrations in drinking water. The relatively low concentrations of V and Th might be that tailings and soils rain-washed into the water bodies have low levels or no V and Th. Mining activities may probably release extremely low levels of V and Th into the environment, and water and sediment are unaffected by the mining activities with regard to the released V and Th. For the water samples (Table 6), the concentrations of Sb, Mn, Cu, Al, Co, and As at Mile 7 and Teberebie springs are 3.69–9.43ppm, 6.25–21.2ppm, 0.35–4.65ppm, 17.6–27.3ppm , 0.498– 14.4ppm and 0.22–1.29ppm, respectively. The reason for these high levels in spring water samples may be similar to that assigned to rivers. The concentrations of all these elements in the springs were relatively lower than those found in riverine water. This may be due to the water current in the rivers which causes regular interaction between the benthic zones and the littoral zones. There is virtually no movement in the spring waters and interaction between the bottom sediments and the water column is minimal. The low levels of Th and V in the springs may be due to the fact that the soils washed into these water bodies contain low levels of these elements. The Hg and Cd levels in the Mile 7 spring were found to be below detectable limits. This could be due to the unavailability of these sources of water to illegal gold miners for use in the study area due to its proximity to the inhabitants of Mile 7 community. However, Teberebie spring 2 recorded some levels of Hg and Cd in its water samples. This may be due to the indiscriminate contamination of these springs by illegal miners in the study area. In general, the elemental concentrations in the Teberebie springs are higher than Mile 7 spring water samples. The proximity of the Teberebie springs to the two gold mines as well as the likelihood for them to be used by illegal miners may be a contributory factor. The riverine sediments showed the highest concentrations for all the monitored elements. The levels of Sb, Mn, Cu, V, Al, Co, Hg, As, Cd and Th are 38.86–308.91, 364.83–36468, 13.00– 20.15, 86422.9–172274, 2.09–20.02, 0.054–0.21, 5.41–13.39, 0.31–0.66, and 8.68–12.91, respectively (Table 3). In general, the concentrations of the elements in the sediment samples are higher than that of the water and this might be due to the fact that metals can be either transported with the water or suspended sediment stored within the riverbed bottom sediment as reported by Adomako et al. [24]. Also, suspended sediments and metallic chemical solids are stored in riverbed sediment after they aggregate to form large denser particles that settle at the bottom of the water. The high levels of all the examined elements in riverine sediments is worrying since this may result in the reduction in the benthic biodiversity, where pollutant- tolerant species may probably take over the vacated niche as reported by Okweye et al. [36]. In addition, the high concentrations may serve as secondary pollution source even when the main pollution is reduced or eliminated. It was also observed that the sediments of springs exhibited high levels of Sb, Mn, Cu, V, Co, As and Th. Teberebie springs recorded the highest levels probably due to their closeness to the pollution sources and sedimentation caused by soil erosions. In general, the levels of the examined elements in spring sediments are lower than in riverine sediments which may be due to the various drainage systems in the study area which are connected to the rivers. 522
L K. Boamponsemet al J. Chem. Pharm. Res., 2010, 2(3):504-527 _____________________________________________________________________________ 4.2 The correlation matrix of the elements in revirine water samples demonstrates good inter- relationships between two groups of elements namely: Sb-Mn-V-Co-As-Hg-Cd-Th and Sb-Mn- Cu-V-Al-Co-As-Cd-Th groups. This relationship within the two groups suggests a common source of these elements into the water. The Sb-Mn-V-Co-As-Hg-Cd-Th group is likely to be anthropogenic inputs resulting from mine waste discharges into the river system and atmospheric depositions. The Sb-Mn-Cu-V-Al-Co-As-Cd-Th group might be from other point and non-point and natural sources. Al and Mn are major lithogene elements and their association with other elements in the water column may indicate a natural origin probably from parent materials of bottom sediments. Almost the same trend of elemental associations in riverine water was observed in spring water (Table 8). Two groups of elements emerged from the correlation analysis namely the Sb-Mn-V- Al-Cu-Co-Cd-Th and Sb-As-Hg-Th groups. The clustering of these metals may indicate the common sources of these elements. The Sb-As-Hg-Th group might be from anthropogenic sources since Hg is not a common component of the earth’s crust. The Sb-Mn-V-Al-Cu-Co-Cd- Th group might have come from point and non-point natural sources. The high correlation coefficients for elements in water-sediment in streams of the study area suggest that there is strong relationship between water and sediment element concentrations in the river and spring waters. With all the elements showing positive corrections (70% showing strong positive correlation coefficients) in riverine water-sediment, it can be inferred that the water current aided in the interactions between the water column and bed sediments. About 60% of positive correlation coefficients (40% showing strong positive correlations) for springs suggest that the virtual stillness of the water bodies may have accounted for the differences with riverine water. Similar correlations between water and sediment levels have been reported from several global locations [28, 37, 38, 39]. The general strong correlation between element concentrations in water and sediment indicates the possibility of the sediments acting as secondary pollution source. 4.3 Contamination degrees (Cd) of streams The contamination degrees have revealed that Angonabeng and Bediabewu rivers are heavily polluted with Sb, Mn, Cu, Al, Hg, As and Cd (Table 9). This is not surprising since these two rivers flow through the two mines of the study area, and are believed to be actively used by illegal miners for their operations. Teberebie springs are not left out in the operations of the galamsey operators. The closeness of the two sampled springs to the soil sampling points of Teberebie soils may account for the connections of the elemental levels in these samples. The soil samples have relatively high levels of these elements and due to soil erosion as well as run- off water it is likely these elements might get into the springs. Mile 7 soil samples have relatively low levels of Sb, Mn, Cu, Al and As, and that run-off due to soil erosion may contain low levels of these elements into these streams. 4.4 Quantification of stream sediment pollution TheContamination Factor (CF) assessment of the quality of sediment has revealed that the Teberebie spring 2 is mainly polluted with Sb, Mn V, Al and Cd, and unpolluted to slightly polluted with Cu, Co, As, Hg and Th. This is likely to be the result of the closeness of the spring Relationships between heavy metals in streams 523
L K. Boamponsemet al J. Chem. Pharm. Res., 2010, 2(3):504-527 _____________________________________________________________________________ to the mining plants. Mile 7 spring 1 sediment is mainly polluted with Sb, and slightly to unpolluted with Mn, Cu, V, Al, Co, Hg, As, Cd and Th. This is not surprising since this spring is located far away from the probable anthropogenic pollution sources due to mining and agricultural chemicals. The general Pollution Loads (PLIs) of the Mile 7 spring 1 and Teberebie spring 2 are less than 1.0, suggesting the unpolluted nature of these springs with respect to the 10 examined elements. However, Teberebie spring 3 is heavily affected by anthropogenic and natural sources of the ten examined elements according to its PLI value (2.1). Angonabeng river at Mile 6 and 7 is heavily polluted with Sb, Mn, V, Al and Cd.This same river is slightly polluted to unpolluted with Cu, Co, Hg and Th. The gross pollution of this river might be due to the proximity to the main pollution source and the indiscriminate use of this water body by illegal miners in the area. This river crosses the main mining untarred road linking Mile 6 to Mile 7, and massive settling of dust and other chemicals in the river could also contribute to its pollution. The overall Pollution Load Index of this river as far as the 10 examined elements are concerned is 1.1. This is regarded on the pollution scale as a progressive deterioration of the water quality. The Bediabewu river of Teberebie is also mainly heavily polluted with Sb, V, Al, As, Cd and Th, and slightly polluted to unpolluted with Mn, Cu, Co and Hg. This is likely as a result of the closeness of this river to one of the main mine plants at Teberebie. This river is also used by illegal miners in the area and their activities might be the cause of the elevated levels of these elements in the sediments of this river. The overall Pollution Load Index of this river is 1.43, slightly higher than PLI value for Angonabeng river. The results show that these two rivers are adversely affected by the mining activities in the study area. The Pollution Load Index (PLI) and the contamination degree (Cd) results have revealed that the amount of the examined elements in the water column depends on the amount in the sediments, and they are directly proportional. The Geoaccumulation Index (Igeo) calculations of the sediment samples have revealed the anthropogenic sources for some of the examined elements. The Igeo values for Mn and Sb for Teberebie spring 3 indicate that the springs are strongly polluted by these elements. Teberebie spring 3 is moderately polluted with V and Co, as suggested by the Igeo values. The results also show the practically unpolluted status for all the water bodies with the elements; Cu, Al, Hg, As and Cd, and unpolluted to slightly polluted with Th. The Igeo values for all the elements for Mile 7 spring show practically unpolluted status of this water body with the Al, As, Cd, Co, Cu, Hg, Mn, Sb and V and unpolluted to moderately polluted with Th. The Angonabeng river is strongly to very strongly polluted with Sb and Mn, and also unpolluted to moderately polluted with Cd. The Igeo values also show that this river is practically unpolluted with Cu, V, Co, As, Al, Hg and Th. The Igeo values suggest that the Bediabewu river is very strongly polluted with Sb and unpolluted to moderately polluted with Al and V. This river is also shown to be practically unpolluted with, Co, Cu, Cd, Hg, As, Mn and Th. The Enrichment Factor (EF) computation for the elements in Teberebie has revealed that Teberebie spring sediments are significantly enriched with Sb, Mn, V and Co. It also shows that these springs are depleted to minimal enrichment with Cu, V, Cd, As, and Th. Mile 7 spring sediments are also found to be significantly enriched with Sb, V and Th, and depleted to minimally enriched with Mn, Cu, Co, Hg, As and Cd. The EFs results show that the Angonabeng 524
L K. Boamponsemet al J. Chem. Pharm. Res., 2010, 2(3):504-527 _____________________________________________________________________________ river is significantly enriched with Sb and Mn, and depleted to minimally enriched with Cu, Co, V, Hg, Cd, As and Th. The Bediabewu river, on the other hand, is found to be significantly enriched with Sb and depleted to minimally enriched with Mn, Cu, V, Co, Hg, Cd, As and Th. The various enrichments of the elements in streams may be due to the mining activities and natural sources. CONCLUSION The results of this study have generally shown high levels of all the ten examined elements in the streams water and sediment samples during the period the samples were studied. Angonabeng and Bediabewu rivers are few miles away from the processing sites of the two major mines in the study area, and direct and indirect discharge of mine waste may be a contributing factor to the high levels of Sb, Mn, Cu, Al, Co, Hg and As in the water samples. High concentrations of most of the heavy metals observed in almost all the streams may have a detrimental effect on the health of the inhabitants of the communities that use the river directly without treatment for domestic purposes. Attention is, therefore, being drawn to the fast degrading nature of the streams of the study area, which requires good environmental practices and constant monitoring to curtail any unanticipated disaster. The water-sediment correlation matrix, Pollution Load Index (PLI) and the Contamination degree (Cd) results from this study have revealed that the amount of the examined elements in the water column depends on the amount in the sediments, and are directly proportional. This research may serve as a reference for future studies on the assessment of the levels of toxic metals in the study area. It is envisaged that the results of this study will enrich the discussion and understanding of the effects of mining activities on the environment as well as the health implications of people. It is recommended that bioavailability of metals to aquatic organisms involving metal speciation and exposure modeling using the Windermere humic acid aqueous model (WHAM) and Biotic Ligand Models (BLM) are integrated in future studies on metals assessment of streams of mining areas. Acknowledgements The first author wishes to express his sincere gratitude to the Ghana Atomic Energy Commission (GAEC), for their technical assistant which has made the analysis of the samples possible. Special thanks to Professor B. J. B. Nyarko, his team of operators and the technicians of NAA laboratory of GHARR-1 Centre. REFERENCES [1]RJ Griffis; K Barning, FL Agezo; FK Akosah. Commission of Ghana, 2002 [2]SN Addy (1998). Resource policy, 1998, 24(4), 229-239. [3]BNA Aryee. Resource Policy, 2001, 27, 61-75. [4]BJB Nyarko; Y Serfor-Armah; EHK Akaho; D Adomako; S Osae. Journal of Applied Science and Technology (JAST), 2004, 9 (1&2), 28-33. [5]J Zhou; Z Dang; M Cai, M; C Liu, C. Pedosphere, 2007, 17(5), 588–594. 525
L K. Boamponsemet al J. Chem. Pharm. Res., 2010, 2(3):504-527 _____________________________________________________________________________ [6]SB Dampare; Y Ameyaw; DK Adotey; S Osae; Y Serfor-Armah, BJB Nyarko, B. J. B; D Adomako. Water, Air, and Soil Pollution, 2006, 169, 185-206. [7]Y Teng; S Ni; P Jiao; J Deng; C Zhang; J Wang, J. Chinese Journal of Geochemistry, 2004, 23(4), 351-357. [8]B Kumi-Boateng. M.Sc. Thesis ,International Institute for Geo-information Science and Earth Observation, (Enschede, The Netherlands, 2007). [9]SN Sin; H Chua; W Lo, LM Ng. Environment International, 2001, 26, 297-301. [10]S Amasa. Envir. Health Prospect, 1985, 12, 131-135. [11]U.S. EPA. REPA2-0920-002, San Francisco, California, USA, 2001. [12]M Anane. [http://www.corpwatch.org/news/2001/0233.html], (accessed 2009 November 24). [13]B Das. Environ Geol, 2005, 49, 230-239. [14]MD Walters. In: RA Goyer; MA Mehlman M.A., ed, Advances in modern toxicology. Vol. 2. Toxicology of trace elements. New York, 1977, pp.147-189. [15]A Kemp; R; Thomas, R. Water, Air and Soil Pollut., 1976, 5, 469–490. [16] A Aksoy; D Demirezen; F Duman, F. Water, Air andSoil Pollution, 2005, 164, 241-255. [17]HL Nguyen; M Leermakers; J Osan; S Torok; W Baeyens, W. Science of the Total Environment, 2005, 340, 213-230. [18]Y Serfor-Armah; BJB Nyarko; D Adotey; SB Dampare; D Adomako, D. Water, Air, and Soil pollution, 2006, 175, 181-192. [19]TM Akabzaa; BK Benoeng-Yakubo; JS Seyire. West African Journal of Applied Ecology, 2007, 11, 101-109. [20]BK Kortatsi. PhD thesis, University of Ghana ( Legon-Accra, Ghana, 2004). [21]GFGL (Goldfields Ghana Limited). Tarkwa Tyre Retreat Facility, EIS, 2007, Pp. 16-24 [22]T Akabzaa; A Darimani. Draft Report for SARPRI, 2001, Pp. 1-64. [23]JB Tando, Y Bredwa-Mensah; SB Dampare; EHK Akaho; BJB Nyarko. Nucl. Inst. Methods in Physics Research B, 2009, 267, 1924-1930. [24]D Adomako; BJB Nyarko; SB Dampare; Y Serfor-Armah; S Osae; JR Fianko; EHK Akaho, E. H. K. Environ Monit Assess, 2008, 141, 165–175. [25]C Gonzalez-Macias; I Schifter; DB Lluch-cota; L Mendez-Rodriguez; S Hernandez- Vazquez. Environmental Monitoring and Assessment, 2006, 118, 211–230. [26]W Grzebisz; L Cieoela; J Komisarek, J; J Potarzycki (2002). Polish Journal of Environmental Studies, 2002, 11(5), 493-499. [27]H Lokeshwari; GT Chandrappa. Research and Management, 2007, 12, 121-128. [28]AR Karbassi; SM Monvari; GRN Bidhendi; J Nouri, J; K Nemapour. Environ. Monit. Assess, 2008, 147, 107-116. [29]J Yaqin; Y Feng; W Jianhui; Z Tan; B Zhipeng; D Chiging. Journal of Environmental Sciences, 2008, 20, 571-578. [30]LK Boamponsem; JI Adam, SB Dampare, BJB Nyarko; DK Essumang. Nuclear Instruments and Methods in Physics Research B, 2010, 268, 1492–1501. [31]MAH Bhuiyan; L Parvez; MA Islam; SB Dampare; S Suzuki. Journal of Hazardous Materials,2010, 179, 1065-1077. [32]PS Harikumar; TS Jisha. International Journal of Engineering Science and Technology, 2010, 2(5), 840-850. [33]KK Turekian; KH Wedepohl, K. H. Bulletin of Geological Society of America, 1961, 72, 175–192. 526
L K. Boamponsemet al J. Chem. Pharm. Res., 2010, 2(3):504-527 _____________________________________________________________________________ [34]DL Tomlinson; JG Wilson; CR Harris; DW Jeffrey. Helgol Meeresunters, 1980, 33, 566- 575. [35]World Health Organization (WHO). Guideline for Drinking-water Quality. Third edition, volume 1, Geneva, Switzerland, 2004. [36]P Okweye; T Tsegaye; K Golson-Garner. Alabama A&M University, Normal, USA, 2009. [37]U Forstner; W Ahlf; W Calmano; M Kersten, M. In D. Helling, P. Rothe, U. Forstner, P. Stoffers (Ed.), Springer Verlag 1990. [38]A Horowitz, Paper No. 2277, 1985. [39]PN Linnik. Hydrobiological Journal , 2001, 37, 73–86. 527