Download
1 / 15
150 likes | 157 Views
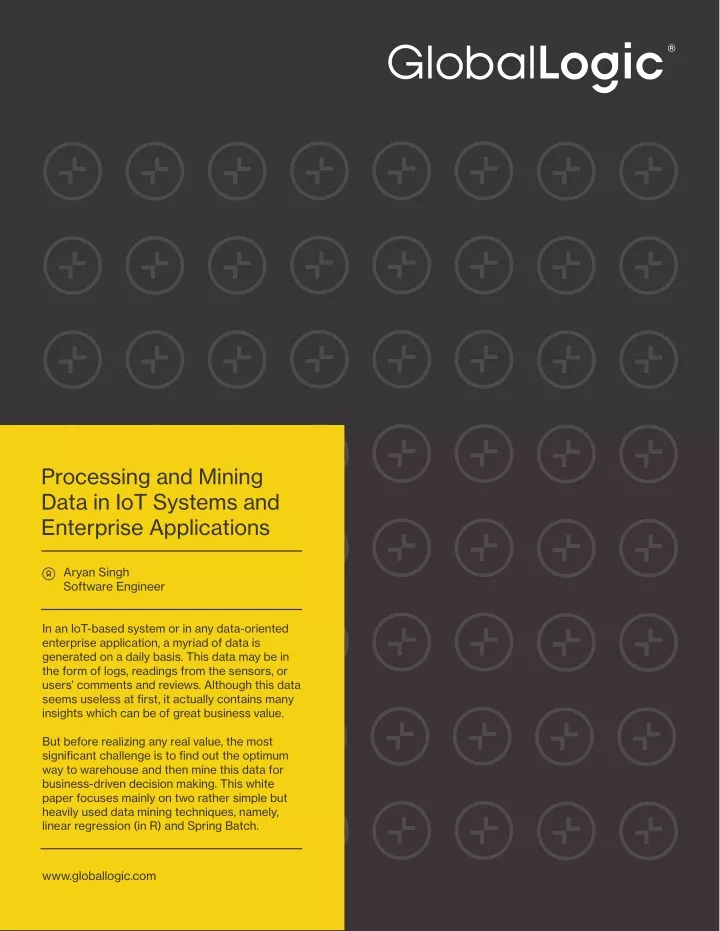
In an IoT-based system or in any data-oriented<br>enterprise application, a myriad of data is<br>generated on a daily basis. This data may be in<br>the form of logs, readings from the sensors, or<br>usersu2019 comments and reviews. Although this data<br>seems useless at first, it actually contains many<br>insights which can be of great business value.

E N D
Processing and Mining Data in IoT Systems and Enterprise Applications Aryan Singh Software Engineer In an IoT-based system or in any data-oriented enterprise application, a myriad of data is generated on a daily basis. This data may be in the form of logs, readings from the sensors, or users’ comments and reviews. Although this data seems useless at first, it actually contains many insights which can be of great business value. But before realizing any real value, the most significant challenge is to find out the optimum way to warehouse and then mine this data for business-driven decision making. This white paper focuses mainly on two rather simple but heavily used data mining techniques, namely, linear regression (in R) and Spring Batch. www.globallogic.com
Processing and Mining Data in IoT Systems and Enterprise Applications Aryan Singh, Software Engineer Table of Contents Challenges in Data-Driven Applications ............................................................................................................................................................. 3 Warehousing the Data in IoT Systems ................................................................................................................................................................. 4 Predicting Future Consumption Using Linear Regression ........................................................................................................................... 4 Formulating the Linear Model Using R ................................................................................................................................................................ 6 Spring Batch to Extract Transform and Load Data .......................................................................................................................................... How to Configure a Simple Spring Batch Application ............................................................................................................ Spring Batch (Java) - R Integration .................................................................................................................................................. 7 9 12 Detecting Data Anomalies Using Spring Batch ................................................................................................................................................ 14 References ................................................................................................................................................................................................................... 14 About GlobalLogic ..................................................................................................................................................................................................... 14 GlobalLogic Inc. www.globallogic.com 2
Processing and Mining Data in IoT Systems and Enterprise Applications Aryan Singh, Software Engineer Challenges in Data-Driven Applications The foremost thing to consider while designing a data-driven application is to study the use cases thoroughly. Often engineers forget about the proper visualization of a use case and jump straight to the coding details, which leads to nothing but a bad data model and unrealistic results. In my case, I was working on an application called Electrack, which helps users minimize their electricity expenses by keeping track of their daily consumption. Besides that, it addresses the pertinent issue of electricity wastage and theft by detecting the inconsistencies at distribution end points. This implies a couple of use cases. First, to predict future units of electricity that will be consumed by the user on the basis of the previous consumption data. Second, to devise a system for detecting electricity fraud by filtering out the anomalies in the data transferred by the sensor integrated with the electricity meter. Once the use cases have been identified, the next step is to come up with the best solution for these use cases. To extrapolate future insights from a data set, you need to come up with a data model that best fits the data set at hand. If your data represents a linear relationship among a combination of variables, then linear regression will provide a robust solution in many cases. We will be looking at linear regression in greater detail later. For anomaly detection, we needed a fast way to skim through the sensor data and dump filtered fraudulent cases into a database or other repository. Here Spring Batch, a mature flavor of batch processing offered by the Java Spring framework, is the right direction. Its built-in support for various NoSQL databases, multithreading, and a specialized architecture for data processing make it a very fast and reliable technology for data-driven applications. A typical IoT-based system generating this data can be visualized as shown in Figure 1. Google Cloud Messaging Internet Internet Electricity Measurement System Web Server Mongo DB Figure 1. High-level view of a typical IoT- based system Android Analytics Server GlobalLogic Inc. www.globallogic.com 3
Processing and Mining Data in IoT Systems and Enterprise Applications Aryan Singh, Software Engineer Warehousing the Data in IoT Systems In an IoT-based application warehousing the data can be really challenging. Before drawing insights from data one needs to warehouse it in such a way that it can be easily retrieved for analysis. The multitude of available options can cause a lot of confusion. Broadly speaking, there are two alternatives for a database system to store the sensor data, traditional RDBMS systems or NoSQL. But to warehouse periodic sensor data, NoSQL’s non-relational, document-based structure is the ideal recourse. In my use case, a REST web service was exposed to a GPRS module in the hardware to send the sensor data to our NoSQL database periodically. The database we used for this purpose was MongoDB. A sample document for the transferred sensor data is shown below: { “_id”:{ “$oid”:”572ad7285ee473bd4ac4277f” }, “units”:[ { “unit”:16361, “time”:{ “$date”:”2016-05-05T05:16:24.455Z” } }, { “unit”:16791, “time”:{ “$date”:”2016-05-05T05:16:26.891Z” } } ] } Predicting Future Consumption Using Linear Regression What is linear regression? Linear regression is a supervised learning technique in which the variation in a continuous dependent variable is expressed in terms of coefficients of various independent variables. These coefficients vary proportional to the impact, that the changes in a specific independent variable have on the value of the dependent variable. Simply put, there is a value on one side that depends on a combination of factors, and you need to find the line that best explains the relationship between that value and the factors impacting it. An example of this is electricity units consumed at a particular house compared with the number of appliances and the duration of time. These two factors definitely have an impact on the units consumed, with the consumed units increasing with the number of appliances and the time duration while they are active. GlobalLogic Inc. www.globallogic.com 4
Processing and Mining Data in IoT Systems and Enterprise Applications Aryan Singh, Software Engineer A simpler example is the linear regression in a single variable where the variation of a single factor affects the value of the dependent variable. In this use case, the factor impacting the number of electricity units consumed was the month: the number of units consumed, varies on a monthly basis and the graph for this data generated by R is illustrated in Figure 2. Linear Regression Units Consumed 3000 a2 a1 1000 0 1 2 3 4 5 Month of Year Figure 2: Linear regression showing units of electricity consumed by month In Figure 2, units of electricity consumed are represented on the y-axis and months on the x-axis. In the graph, a1 and a2 mark the cost or offset for an individual data point. The cost is the difference between the actual value (represented by the open dots) and the one predicted by the line of best fit. The overall cost function is actually calculated by adding the cost for individual data points squared. Squaring this difference prevents the cost value for the data points lying below the regression line from canceling out the cost value for those points which lie above the regression line. Thus a least square cost function is represented as J = Σn point value and the one that is predicted by the line of best fit. 2 where ai is the difference between the actual data i=1 ai GlobalLogic Inc. www.globallogic.com 5
Processing and Mining Data in IoT Systems and Enterprise Applications Aryan Singh, Software Engineer There are many methods, such as gradient descent, to minimize this cost function, but these are out of scope for this paper. To learn more, visit Andrew Ng’s. A typical surface plot for minimizing descent cost function by gradient is shown in Figure 3. Figure 3. A typical surface plot for minimizing descent cost function by gradient Formulating the Linear Model Using R Once the data model has been finalized, next step is to devise the line of best fit based on the electricity units consumed and the time vector (representing months). A vector in R is nothing but a [1xn] matrix containing the individual data values. The regression line for the data points can be found by using the function lm in R, which gives an accurate representation of a linear model. A code snippet for generating the regression line looks like this: monthVector <- 0:5 unitVector <- c(510,1400,1712,2289,2869,3589) plot(monthVector,unitVector,xlab = “Month Of Year”, ylab = “Units Consumed”, main = “Linear Regression”); abline(lm(unitVector~monthVector)); coefficients(lm(unitVector~monthVector)); summary(lm(unitVector~monthVector)); GlobalLogic Inc. www.globallogic.com 6
Processing and Mining Data in IoT Systems and Enterprise Applications Aryan Singh, Software Engineer Significant points in this code are: • The plot function provides a visual representation of the data. By visualizing the data you can determine if there is a linear relationship between the two variables. The ab line function plots the line of best fit through the graph. The coefficients() is a function that provides the y intercept and the x coefficient for the line of best fit. For the set of data above, it looks something like this: • • (Intercept) monthVector 605.8571 582.2571 So you can write the regression expression as unitsConsumed = 605.8571 + 582.2571*month • The summary() function gives a more detailed output, shown below. Estimate 605.8571 582.2571 Std. Error 96.4543 31.8578 t value 6.28 18.28 Pr(>|t|) 0.0033 0.0001 (intercept) monthVector Multiple R-squared: 0.9882, Adjusted R-squared: 0.9852 Here R-squared is a measure of the accuracy and tells us that how well the regression line fits the data. Also it explains, how well the regression line can determine the standard deviation as compared to the mean of the data. Simply put, a value of 0.985 indicates a 98.5% accuracy for the model. Spring Batch to Extract, Transform, and Load Data Once the algorithm for the data model has been developed, the next thing is to find a way to load the NoSQL data into R. Though there are packages such as rMongo for this purpose, they are not optimal and do not support multithreading under the hood. So Spring Batch is a great option for performing this kind of operation. What is Spring Batch? Spring Batch is a flavor of batch processing offered by Java’s Spring framework. Spring Batch provides the capability to read, process, and write data from and to multiple data sources. So it is similar to the extract, transform, and load capabilities of BI (Business Intelligence) platforms such as SAS. GlobalLogic Inc. www.globallogic.com 7
Processing and Mining Data in IoT Systems and Enterprise Applications Aryan Singh, Software Engineer Also it has built-in capabilities to multithread the batch process, in which you can specify the maximum size of thread pool and the chunks in which data would be processed. Spring Batch maintains the required number of threads according to the chunks of data that need to be transferred. A Spring Batch job consists of one or more steps, as shown below. Item Reader Item Processor Item Writer Data Source Output Data Job Listener Figure 4. A typical Spring Batch data flow A Spring Batch application usually includes one or more steps. These are the main components in each step of a typical Spring Batch system: Reader: A reader, as the name implies, reads chunks of data from a data source. This data source could be a text file, a CSV file, relational database, or a NoSQL database. The reader can be multithreaded with a thread pool executor managing the number of active threads. In this case however the sequence of the data chunks read is random. Essentially this is the extract step when compared to a traditional ETL job. • Processor: The processor is the transform step in which the read data is processed into a the form required for the writer. This is the part where most of the business logic is applied to the data. Once the data has been converted to the desired form, it is passed on to the writer and is ready to be written to a database or any other data source. • Writer: This is the load step in the ETL job. The processed data is output to a relational database or a NoSQL database. The writer can also be multithreaded by using a task executor. However, when multithreading is used, the order of writing is arbitrary and not sequential. • Listener: The listener is an ad-hoc step in the process and may involve sending out emails to stakeholders, pushing notifications to devices, etc. It listens to time frames in the job’s life cycle such as before the job begins or after it ends. It allows the developer to do some additional tasks at these junctures. • GlobalLogic Inc. www.globallogic.com 8
Processing and Mining Data in IoT Systems and Enterprise Applications Aryan Singh, Software Engineer How to Configure a Simple Spring Batch Application A typical Spring Batch Configuration looks like this: Class - BatchConfiguration @Configuration @EnableBatchProcessing @EnableScheduling public class BatchConfiguration{ @Autowired public JobBuilderFactory jobBuilderFactory; @Autowired public StepBuilderFactory stepBuilderFactory; @Autowired public MongoTemplate mongoTemplate; /* A mongo item reader reads data from a MongoDB collection in chunks. */ @Bean @StepScope public MongoItemReader<R> reader() { MongoItemReader<R> reader = new MongoItemReader<R>(); reader.setTemplate(mongoTemplate); reader.setCollection(“r”); reader.setQuery(“{}”); reader.setSort(new HashMap<String,Direction>(){{put(“_id”, Direction.ASC);}}); reader.setTargetType(T.class); return reader; } /* Defining the item processor bean. */ @Bean public MongoProcessor mongoProcessor(){ return new MongoProcessor(); } /* A mongo item writer that writes the data to a collction in MongoDB. */ @Bean @StepScope public MongoItemWriter<W> mongoWriter() { MongoItemWriter<W> writer = new MongoItemWriter<W>(); writer.setTemplate(mongoTemplate); writer.setCollection(“w”); return writer; GlobalLogic Inc. www.globallogic.com 9
Processing and Mining Data in IoT Systems and Enterprise Applications Aryan Singh, Software Engineer } /* Declaring the Job Listener Bean. */ @Bean public MongoJobListener mongoJobListener(){ return new MongoJobListener(mongoTemplate,mongoRepository); } /* Defining a step for the job with multithreaded configuration using taskExecutor and a throttleLimit of 10. Items are processed in chunks of 50. */ @Bean public Step step1() { return stepBuilderFactory.get(“step1”) .<R,W> chunk(50) .reader(reader()) .processor(processor()) .writer(writer()) .taskExecutor(taskExecutor()) .throttleLimit(10) .allowStartIfComplete(true) .build(); } /* Defining the Job Bean. It is initiated by passin in the step and the listener. */ @Bean public Job mongoJob() { return jobBuilderFactory.get(“mongoJob”) .incrementer(new RunIdIncrementer()) .listener(mongoJobListener()) .flow(step1()) .end() .build(); } } Class - MongoProcessor public class MongoProcessor implements ItemProcessor<R, W>{ @Override public W process(R r) throws Exception { /* Business logic to transform reader item i.e. R to the writer item W takes place here.In this case the R(language) code will be called here to predict the data. */ } } GlobalLogic Inc. www.globallogic.com 10
Processing and Mining Data in IoT Systems and Enterprise Applications Aryan Singh, Software Engineer Class - MongoJobListener public class MongoJobListener extends JobExecutionListenerSupport{ @Override public void afterJob(JobExecution jobExecution) { /* Work to be done after the Job completes is done here. */ } } The code is pretty straightforward. A job called mongoJob is declared. It has two main components a step and a listener. A step, like the step1 declared above, consists of an itemReader, itemProcessor, and itemWriter. To make the batch multithreaded, add a taskExecutor, which is equivalent to a thread pool executor. It makes sure that the maximum number of threads given by throttleLimit are used judiciously to process the data in the number of chunks defined by the chunk method above. Note: R in the above snippets is the type/bean of the data that has to be read and W is the type/bean of data that has to be written back to MongoDB. A sequence diagram of a step is shown in Figure 5. Step Item Reader Item Processor Item Writer execute() read() item process(item) item read() item process(item) item write(items) Figure 5. Sequence diagram of a step ExitStatus GlobalLogic Inc. www.globallogic.com 11
Processing and Mining Data in IoT Systems and Enterprise Applications Aryan Singh, Software Engineer Spring Batch (Java) - R Integration There are two main flavors for integrating R and Java, namely rJava (an API-based solution) and Rserve (a client-server-based solution). Of the two, Rserve is easier to configure and can be used in a multiple processing mode, since it can handle multiple requests at the same time. Once the data has been loaded from the reader and is passed on to the processor, the r code for linear modeling will be called in the process method of this processor to predict future consumption. A typical code snippet looks like this: @Override public W process(R r) throws Exception { double[] units = r.getUnits(); RConnection rConnection = new RConnection(); String timeVector = “c(0”; String unitVector = “c(“; for(int i = 1;i<units .length;i++){ unitVector+=”,”+String.valueOf(units.get(i)); timeVector+=”,”+String.valueOf(i); } rConnection.eval(“time=” + timeVector); rConnection.eval(“units=” + unitVector); double[] coeff=rConnection.eval(“coefficients(lm(units~time))”). asDoubles(); coeff[0] = (double) Math.round(coeff[0] * 100) / 100; coeff[1] = (double) Math.round(coeff[1] * 100) / 100; /*coeff[0] is the y(units consumed) intercept and coeff[1] is the coefficient of x(time). Thus this gives us the regression line. */ int unitsSize = units.length; /*The snippet below is a simplified version of the predition calculation. The actual implementation is different. */ List<Double> predictedUnits = new ArrayList<Double>(0); for(int i=unitsSize;i<(unitsSize+2);i++){ predictedUnits .add(coeff[0]+coeff[1]*i); } W w = new W(); w.setPredictedUnits(predictedUnits); return w; } GlobalLogic Inc. www.globallogic.com 12
Processing and Mining Data in IoT Systems and Enterprise Applications Aryan Singh, Software Engineer The code shown above performs the linear regression in R through Java. 1. 2. Once that is done, the units and the time vector are constructed by iterating through the units obtained from the reader data POJO. 3. Then these vectors are passed to R to devise a linear model and find the regression line. 4. Once the regression equation is obtained, it is used to predict the future values of units and then these predicted units are set into the writer bean. 5. From here the processor returns this writer bean to the writer from where it is written into the database. A connection is made to the rServe server. The complete code for the above examples can be downloaded Github. The bar chart for the predicted units is shown in Figure 6. Figure 6. Bar chart for predicted units of electricity used by month GlobalLogic Inc. www.globallogic.com 13
Processing and Mining Data in IoT Systems and Enterprise Applications Aryan Singh, Software Engineer Detecting Data Anomalies Using Spring Batch Continuing this analysis, Spring Batch can be used effectively to detect inconsistencies in the data and filter out data that is not structured properly. Relating to my use case the anomalies and possible cases of electricity theft were filtered out as follows : 1. 2. The processor had the business logic to filter out the doubtful cases, transform them into the writer type bean and send them forward to the writer. 3. The writer then wrote this data into a MongoDB collection. 4. On completion a listener picked up these records from the database and sent a push notification to the administrator reporting the possible cases of electricity theft and technical glitches in the electricity meters. First, the reader read in the electricity consumption units from the database. This way the abnormalities in the data were detected and reported to the product owner. However, this process can also be used to obtain a refined dataset by filtering out the abnormalities of data in the processor layer itself. Then, data analysis can be performed on this consistent dataset by using Python, R or any other data analytics framework. References • Spring Batch Reference Documentation http://docs.spring.io/spring-batch/reference/html/ • Andrew Ng’s machine learning Course http://cs229.stanford.edu/notes/cs229-notes1.pdf • Integrating R with Java http://www.codophile.com/how-to-integrate-r-with-java-using-rjava/ About the Author Aryan Singh works as a software engineer in the GlobalLogic Noida Delivery Center. He is passionate about data science and machine learning and has worked in versatile data-driven applications ranging from eCommerce to telecom. GlobalLogic Inc. www.globallogic.com 14
About GlobalLogic Inc. GlobalLogic is a full-lifecycle product development services leader that combines chip-to-cloud engineering expertise and vertical industry experience to help our customers design, build, and deliver their next generation products and digital experiences. Headquartered in Silicon Valley, GlobalLogic operates design studios and engineering centers around the world, extending the benefits of our true global presence to customers in telecom, automotive, healthcare, technology, retail, media and entertainment, manufacturing, and semiconductor industries. www.globallogic.com For more information, visit www.globallogic.com