Download
1 / 24
240 likes | 244 Views
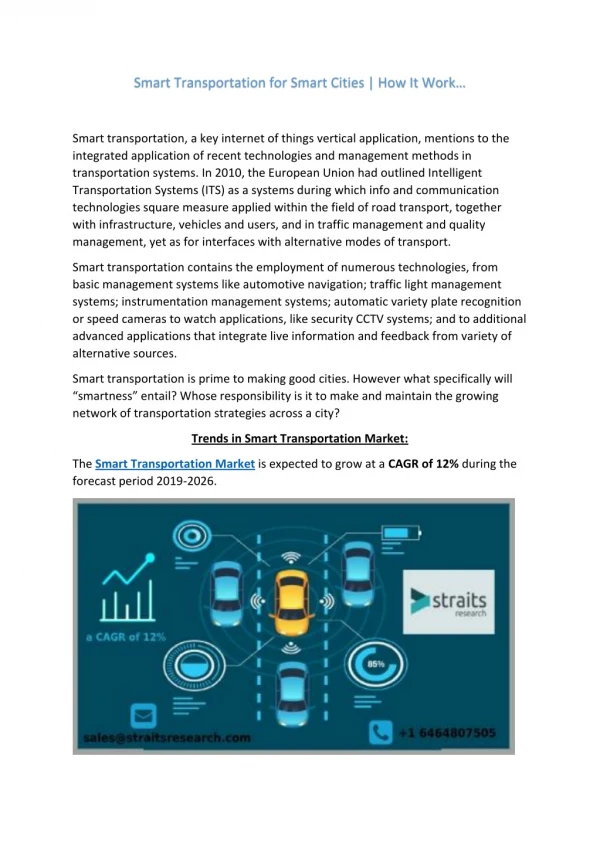
Globally the penetration of advanced technologies such as cloud computing and IoT tends to drive the growth of global smart transportation market. According to Goldstein Research, smart transportation market is expected to reach USD 251.40 billion by 2024, growing at a CAGR of 16.75% during the forecast period (2016-2024).

E N D
Vision Value Visibility Report Code :HC 1002 2016-2024 Global Smart Transportation Market Outlook 2024: Global Opportunity & Growth Analysis, 2016-2024 Request Full Market Report Sample 99 Wall Street, Suite No:- 527, New York, NY 10005 United States of America Office No:- 504, 5th Floor, C-51, BSI Business Park, Sector-62, Noida, PIN:- 201301 India +1-646-568-7747 +1-437-886-1181 +44-203-318-6627 +91-120-473-0422, +91-844-785-9968 www.goldsteinresearch.com sales@goldsteinresearch.com Published By: Goldstein Research Copyright All Rights Reserved, Goldstein Research www.goldsteinresearch.com
1. Executive Summary Fig: 1-2 Global Smart Transportations Market Share(%), By Region- 2016-2024 Fig: 1-1 Global Smart Transportations Market Size USD (Billion). 2016-2024 XX% CAGR: (2016-2024) XX% X% XX% X% XX% XX% XX% 2023 2016 XX% XX% Request Full Market XX% Middle East & Africa Report Sample 2016e 2017e 2018f 2019f 2020f 2021f 2022f 2023f 2024f North America Europe APAC Latin America Source: Goldstein Research Source: Goldstein Research In 2016,vehicle management accounted for the highest market share XX% in Smart Transportations Market WithXX%share in 2016, North America region dominated the collective Global Smart Transportations market Fig: 1-3 Global Smart Transportations Market Share(%), By Compoments-2016 Fig: 1-4 Global Smart Transportations Market Share(%), By platforms-2016 Fig: 1-5 Global Smart Transportations Market Share(%), By Smart Application Type-2016 Vehicle Management Connectivity/M2M Platforms XX% Hardware Mobility Management XX% XX% XX% Infrastructure-as-a- Service (Iaas) Backend Platforms xx% XX% xx% Traffic Management XX% Software Parking Management Hardware specific software Platforms xx% XX% Safety Assistance Consumer/Enterprise Software Extension Platforms XX% xx% XX% Platforms Others Source: Goldstein Research Source: Goldstein Research Source: Goldstein Research Copyright All Rights Reserved, Goldstein Research www.goldsteinresearch.com
Key Findings In 2014 intelligent transport system was identified by ITS America as a major sector of the US economy, comprising 3,000 companies with total revenues of USD XX billion in 2012, with 180,000 private sector jobs in the end-use market, and 445,000 jobs in the total industry value chain; end-use revenue was increased by XX% by 2016, and total industry employment exceed by 500,000. At YSD XX Billion, The U.S. Car rental industry posted record total revenue in 2017 – but the slimmest growth increase since revenues dropped at the start of the recession. However, the industry achieved the revenue on a smaller overall fleet. That translate into revenue-per-unit, per month (RPU) of USD XXX, the first RPU growth year over year in four years and the highest RPU historically recorded by Goldstein Research. Sub-Saharan Africa leads the pack with the fastest average annual growth rate of over XX%. Meanwhile, Asia-Pacific remains by far the largest transport infrastructure market, with investments increasing from USD XX billion per year to nearly USD XX billion per year in 2025. Sales of autonomous vehicles will increase from XXX thousand in 2025 to XX million by 2035, with a cumulative total of XX million self-driving cars in use worldwide. Many cars already have the technologies needed for selfdriving, such as lane- keeping assist and automated braking. But self-driving cars will add SUD 7,000 to USD 10,000 to a car’s price in 2025, dropping to USD 5,000 in 2030 and USD 3,000 in 2035. The two big barriers to development are software reliability and cyber security. The digital augmentation of this market is set to grow at a much more rapid pace and the market for smart transportation, estimated at USD XX billion in 2016 could be in excess of USD XX billion by 2025. This growth of nearly XX% per year provides a significant opportunity for companies that enter early. 2016 XX USD billion Rising Traffic Congestion Request Full Market Report Sample Rising Green House Gas Emission Emergence of Connected Cars Global Smart Transportations Market Size (USD billion) Asia-Pacific Africa XX USD billion Adoption of IoT and Smart Cities XX USD billion XX USD billion 2024 Copyright All Rights Reserved, Goldstein Research www.goldsteinresearch.com
2. Research Methodology Goldstein Research follows a comprehensive and rigorous research methodology to provide you accurate estimates and forecast of a particular market. We provide estimates, forecast and analysis primarily based on secondary research, primary interviews, in-house database and other free as well paid sources. Our company follows simultaneous top down and bottom approach in order to provide you the accurate market sizing. Data triangulation method is strictly followed where we triangulate the data from all the aspects, be it Function Type, application, industry verticals, material, product type or geography. In addition, the research methodology we follow is a systematic approach in order to estimate and project the market sizing keeping in mind all the on-going and upcoming trends of the market. We conduct both primary and secondary research in order to estimate a market and validate our key findings. We put together our effort and prepare an inclusive questionnaire depending on the title of the market we are tracking and extract the important information we require to validate our findings. Our team of Analysts and experts dedicatedly put their effort to provide you the best possible and accurate data and analysis. Adding to that; technological, economic, cultural and social aspects along with the regulatory barriers are completely analysed to understand the comprehensive market scenario across different geographies. Understanding the market from both buyer and seller point of view is important to track a market and provide analysis on the same. We not only provide the market data of the four geographies as a whole, namely, North America, Europe, Asia- Pacific, Latin America, Middle East & Africa and Rest of the World (RoW) but we also provide you qualitative as well we qualitative information on country level bifurcation. We at Goldstein Research provide you: • Precise Estimates and Forecast • Authentic Analysis • In-depth Data and Analysis • Authentic Sources • Reliable Data and Analysis Request Full Market Report Sample Copyright All Rights Reserved, Goldstein Research www.goldsteinresearch.com
3. Major Players Presence-Regional Analysis Major Players/ Industries North America APAC Europe Latin America Middle East & Africa Cisco Systems, Inc Request Full Market Report Sample General Electric Company Siemens AG IBM Corporation Alstom Qualcomm Volkswagen General Motors Low Penetration High Penetration Medium Penetration Copyright All Rights Reserved, Goldstein Research www.goldsteinresearch.com
4. Global Smart Transportations Market Size (USD Billion) & Growth Analysis Fig:- 4-1 Global Smart Transportations Market Size (USD Billion)-2016-2024 Fig:- 4-2 Global Smart Transportations Market Y-O-Y Growth (%) Analysis-2016-2024 XX% XX XX% XX XX XX% XX XX% XX XX XX% XX% XX% XX XX Request Full Market XX% XX% XX% XX% XX XX XX% Report Sample XX% XX% XX% XX XX% XX XX XX% XX XX XX XX% XX XX XX% XX XX% XX 2016 2017 2018 2019 2020 2021 2022 2023 2024 2016e 2017e 2018f 2019f 2020f 2021f 2022f 2023f 2024f Source: Goldstein Research Source: Goldstein Research Global Smart Transportations market is anticipated to expand at a compound annual growth rate of XX% during the forecast period i.e. 2016-2024. Further, “Connected car” penetration will increase globally from XX% in 2012 to XX% in 2017 (and to more than XX% in the United States and Western Europe). Car sharing had nearly 5 million members worldwide in 2014, up from around 350,000 in 2006, and is projected to exceed 23 million members globally by 2024. There are more than 1,000 public bikeshare schemes in more than 50 countries—in 2004, only 11 cities worldwide had such programs.4 Ride-hailing services have seen similarly rapid growth. In six years of operation, Uber’s global footprint has expanded to more than 500 cities in more than 70 countries. Further, from 2014 onward, total global commercial telematics usage will ramp up at an accelerated rate. In fact, in 2019 total global subscriptions will increase by 3x from what they were in 2014. Copyright All Rights Reserved, Goldstein Research www.goldsteinresearch.com
4.1. Global Smart Transportations Market Overview, By Region and Market Players-2016 Fig:- 4-3 Global Smart Transportation Market Share (%), By Country, 2016 Fig:- 4-4 Cumulative transport infrastructure investment to 2025 XX% XX% XX% XX% United States XX% Asia Pacific XX% XX% Europe XX% U.S & Canada Japan Roads China Westen Europe Request Full Market Report Sample XX% Brazil XX% Rail Russia Latin America India Ports Middle East South Korea Mexico Airports Africa XX% Africa XX XX XX XX XX XX ROW Source: Goldstein Research Source: Goldstein Research Considering individual subsectors, ports are predicted to grow the fastest at XX% on average per year over the forecast period (led by large investments in Indonesia, for example), while airport investments are expected to slow down to an annual growth rate of XX%. Western Europe’s share of global transport infrastructure spending is forecast to remain broadly unchanged from XX% in 2014 to XX% in 2025. Likewise, with mature transport networks in the US and Canada, investment is expected to grow by an average of just XX% per year over the coming decade. Overall, a decline in the US-Canada share of global transport spending – from XX% in 2016 to XX% by 2025 – is expected By contrast, large-scale development of transport networks will likely continue in many Asia-Pacific economies, given the shift in economic power from the West to the East, the rise in Asian wealth and rapid urbanisation. Significant investment in road infrastructure to accommodate ever more cars, along with investment in public transport infrastructure to relieve congestion in urban areas, is expected. Copyright All Rights Reserved, Goldstein Research www.goldsteinresearch.com
5.1.1. Market Demand Risk Market Demand Risk-Moderate Request Full Market Report Sample On the basis of Rising concerns towards Environmnet On the basis of Technology Advancement On the basis of Cost-effectiveness demand by adopting cost-effective and advanced cardiac devices & services in the upcoming years. The rise in demand will help the new players to enter into the sector of cardiology and open the doors for the expansion of business by the existing players in the market Rising awareness towards environment & changing lifestyles for the betterment of health are some of the factors swelling the demand for cardiac devices & services. Rapid growth in urbanization leads to hectic and busy schedules which leads to adopt time saving treatment. The high demand from the consumers is expected to make easy for new players to jump into the market of cardiology devices& services and opportunities for the business expansion by existing players in the Smart Transportation market Rise in technological advancemnet coupled with higher risk of chronic diseases and rising prevalence of diabetes and cardiovascular diseases in elderly population further raise the Sample The demand for Smart Transportation is likely to grow due to availability of cost-effective products for cardiac diseases in developing & under- developed countries like Africa , India, etc. Rising demand for Smart Transportation benefits the new players to get into the market to provide affordable products and provide opportunities for expansion of business by existing players in the Smart Transportation market Copyright All Rights Reserved, Goldstein Research www.goldsteinresearch.com
5.1.2. Market Supply Risk Market Supply Risk-Low Request Full Market Report Sample On the basis of Technological Advancements On the basis of Governmental Regulations On the basis of Investment products with less side-effects to the consumers. This is expected to be a huge restrain for the new players to jump into the Smart Transportation market Sample The initial cost to setup cardiac device industry is very high due to requirement of research and development sector and high accuracy and precise healthcare manufacturing equipment with expertise which is expected to put many limitation for the new players in cardiac device market Presence of strict government regulations across the globe for the manufacturing of Smart Transportation to provide safe and secure Due to rise in advancement in healthcare technology by government funding in order to provide portable and high-end devices with better services and to improve care as wells as treatment technology which is expected to raise the supply in the market with new efficient and cost effective products of cardiology Copyright All Rights Reserved, Goldstein Research www.goldsteinresearch.com
5.2.1. Growth Drivers Alliances Between Automakers and Tech Companies Seamless integration of multiple services that allow you to plan your trip, book and pay for it will be the key in the mobility transition. Once we have access to on-demand individual transportation, customers may be more likely to also use regular mass transit for parts of their travel needs, so another important parameter will be how seamlessly the new services will integrate existing public services into their offering. Some automakers are focusing on acquiring ride-hailing or carsharing services, others are busy developing complementary services beyond just moving people (e.g. Volvo’s in-car delivery). Daimler’s Moovel has been under the radar for us in Europe, but they seem to be busy focusing on services and platforms that integrate multiple services and providers, even if it’s not their own brand. It’s surprising that only Toyota has partnered with Uber, I would guess that the biggest ride-hailing company would be the most sought after. Request Full Market Report Sample Volkswagen has partnered with Pivotal to jointly develop innovative software and mobility solutions. The German manufacturer was one of the latest to announce its focus on mobility services, which include car and ride-sharing. Impact Analysis:- Private funding for the advancement in smart transportation sector and initiatives to promote smart transportation across the globe is expected to positively impact on the growth of smart transportations market. Increase in number of connected cars and focusing on R&D od advanced automotive technology is predicted to rise the smart transportation market globally Ford investment of USD 182,2 million in the software start-up Pivotal, whose rapid software development, analytical tools and cloud platform would help improve FordPass and prepare the OEM for autonomous driving Peugeot-Citröen bought USD XX million in shares of the peer-to-peer carsharing Koolicar. The start-up is present in 40 French cities and has more than 60,000 users. High Medium Low Impact on Smart Transportation Market Copyright All Rights Reserved, Goldstein Research www.goldsteinresearch.com
5.1. Growth Drivers Fig: 5-1 The Top 5 Countries with the Highest Rate of Road Traffic Accidents per 1000 vehicles, 2016 High demand of connected cars is driving the smart transportation market A connected car is equipped with Internet access, providing its driver with a multitude of benefits and smart options. These include enhanced engine controls, automatic crash notifications and safety alerts, to name just a few. Apps also allow owners to interact with their vehicle from any distance. The connected car market has the potential to significantly boost revenues for automakers in the next five to seven years, and to establish closer, more profitable connections with their customers. The sophistication of the technologies is impressive, but success won’t be a matter of the technology alone. The growing availability of free telematics services is an important factor that will drive the prospects for growth in this market. Recently, it has been observed that the advent of free services, such as content upgrades, will help to drive the sale of telematics systems among the clients Brands such as Audi are also launching cloud-based telematics services that will facilitate the customization of service packages to meet their customer’s demands Liechtenstein: XXXX Kyrgyzstan: XXXX France: XXXX Slovenia: XXXX Request Full Market Report Sample Thailand: XXXX Croatia: XXXX Impact Analysis:- Real-time information such as vehicle location, speed and mileage is being used by companies to increase productivity, reduce costs, optimize routes, detect maintenance requirement as well as enhance driver and fleet security In the European Union, an initiative - eCall - to bring rapid assistance in case of a collision was proposed and approved by the European Parliament in 2013. In 2015, a regulation was voted in favor of all new cars are to be equipped with eCall technology from April 2018 The German auto parts giant Bosch announced that it would open a new research and development center in Bangalore with plans to invest about USD 200 million in the country in 2014. The R&D center is to focus on all aspects of the connected car, including automotive computer vision, autonomous driving and ADAS functions Samsung and Indian carmaker Tata Motors said they had formed a partnership to offer in-car smartphone-based connectivity in Tata vehicles. Using Samsung’s Drive Link app, the collaboration will provide Tata car owners with music access, hands-free calling and in-car navigation via the smartphone Renault’s unveiling of the Kwid, a new concept car with a built-in drone that can be launched from the vehicle’s roof to observe traffic conditions and to detect obstacles on the road ahead High Medium Low Impact on Smart Transportation Market Copyright All Rights Reserved, Goldstein Research www.goldsteinresearch.com
5.2. Market Restraints Limited Aftermarket Support and Cyber Security One of the key challenges for an OEM to provide aftermarket support is the limited access they have to the vehicle. Any diagnostics or prognostics is possible only when the vehicle is taken to the service station for a scheduled service or repair. The error/fault code memory in electronic control units helps to some extent once the vehicle is in service station, but the whole support is constrained with lack access to vehicle parameters, limited expertise available in the service station, lack of knowledge of how the vehicle is used (driver behavior) etc. Main challenges is that widespread customer acceptance of these programs is far from certain, especially since there has been concern and skepticism regarding privacy, and some drivers question how much they will be scrutinized. Half of the current driving population, is not open to the idea of a UBI—at least in the current market Telematics trailblazers have been collecting massive amounts of data that can reveal driver behaviors, providing a basis for greater precision in underwriting and pricing, but these early adopters still face many challenges in executing a viable telematics program Fig: 5-2 Top 5 Countries for Malware Redirects, 2016 XX% XX% XX% XX% XX% Request Full Market Report Sample XX% XX% XX% XX% XX% XX% XX% USA Canada Germany Netherlands China Source: Primary Source Fig: 5-3 Top 5 Countries Hosting Malware, 2016 Impact Analysis:- In places with no cellular coverage, the app, like other apps, will not work. One may come across dead spots in the countryside or traveling on the highway in such areas, the traffic and routing information will be unavailable until the user reaches an area of connectivity. In essence, if you can't check Facebook or use WhatsApp, then you can't get traffic alerts either The company provides real-time traffic alerts through its website. Anyone can log on to the site and take advantage of alerts scrolled through a small window. XX% XX% XX% XX% XX% XX% XX% XX% XX% XX% XX% XX% XX% XX% High Medium Low USA Russia France Germany Singapore Source: Primary Source Impact on Smart Transportation Market Copyright All Rights Reserved, Goldstein Research www.goldsteinresearch.com
5.4. Impact Analysis on the Basis of Latest Trends in Smart Transportation Drivers of Global Smart Transportation Market Telematics, an amalgamation ‘telecommunications’ and ‘informatics,’ refers to “the use of wireless devices and ‘blackbox’ technologies to transmit data in real time back to an organization. Typically, it's used in the context of automobiles .” The Internet of things (IoT), big data, analytics, and cloud computing are inherent features of the telematics ecosystem. The fleet management market size is estimated to grow from USD XX billion in 2016 to USD XX billion by 2024, at a CAGR of XX% during the forecast period. Fleet management services and solutions are being offered by companies such as Samsung, Intel, Volvo, Verizon, AT&T, TomTom, Vodafone, Telefonica, IBM and CISCO In UK, the government is promoting the use of telematics technology to help organizations manage their fleets more effectively, thereby improving safety and efficiency. It is estimated that the benefits offered by the telematics technology would be able to save USD XX for every USD XX spent on telematics Companies such as Fleetmatics (acquired by Verizon), Teletrac Navman, MiX Telematics and Trimble are working with various government agencies of the words Fleet Management XX% Request Full Market Report Sample Data- enabled trucking management Government Initiative XX% Impact Analysis (on the basis of Latest Trends XX% Real-time information Usage-Based Insurance XX% XX% Source: Goldstein Research Copyright All Rights Reserved, Goldstein Research www.goldsteinresearch.com
Key Takeaways Importance of Connected car to have the same operating system in the dashboard as compared to Consumer devices (Gulf Countries) Essential XX% XX% XX% Important Request Full Market Report Sample Neither Important nor Important XX% Fairly Unimportant XX% Not at all Important Consumer’s Interest in Using Following Connected Cars Technology Operating smartphone using controls on the steering wheel Features to Dictate and Read Emails While Driving Streaming Music Surfing Internet via in-car Monitor XX% XX% XX% XX% XX% XX% XX% XX% XX% XX% XX% XX% Would Like to Use Use Not Interested in it Copyright All Rights Reserved, Goldstein Research www.goldsteinresearch.com
6.1. Global Smart Transportation Market Share(%) - By Product Type,2016-2024 Fig: 6-1 Global Smart Transportation Market Share, By Components Type, 2016- 2024 Key Findings By 2024, we expect the connectivty-related revenues share to increase moderately to approximately XX percent in the global premium car segment. This amounts to a global market size of USD XX billion to XX billion for car connectivity in 2024. The total shipments of OEM embedded telematic devices accounted for more than XX million units across the globe in 2016. The shipments are expected to reach XX million units by 2024 with compound annual growth rate of XX%. Further, Penetration of global embedded telematics to touch XX% for new cars by 2024, while that of tethered telematics to flatten around XX%. Global annual industry revenues from platforms and connectivity solutions are expected to increase sixfold from approximately USD XX billion in 2016 to approximately USD XX billion in 2024. Upfront connectivity hardware revenues are expected to remain the single largest source of revenues globally. Communication Type, 2016-2024 Hardware XX% XX% XX% XX% 2024 Request Full Market Report Sample 2016 Software XX% XX% Platforms Source: Goldstein Research Fig: 6-3 Global Smart Transportation Market Y-O-Y Growth, By Fig: 6-2 Global Smart Transportation Market Size (USD Billion), By Communication Type-2016-2024 XX XX XX XX XX XX 2016 2024 2016e 2017e 2018f 2019f 2020f 2021f 2022f 2023f 2024f Hardware Software Platforms Y-o-Y Source: Goldstein Research Source: Goldstein Research Copyright All Rights Reserved, Goldstein Research www.goldsteinresearch.com
6.1.2 Global Smart Transportation Market Attractiveness and BPS Analysis by Telematics Devices, 2016-2024 Fig: 6-7 Global Smart Transportation Market Attractiveness-By Telematic Devices, 2016-2024 Fig: 6-8 Global Smart Transportation Market BPS Analysis- By End Telematic devices, 2016-2024 XX% 100% XX% 90% XX% XX% 80% XX% 70% XX% XX% 60% Request Full Market Report Sample XX% XX% 50% 40% XX% 30% XX% XX% XX% 20% XX% 10% 0% XX% 2016 2024 XX XX XX XX XX XX XX XX XX XX Hardware Software Platforms Hardware Platforms Software2 Source: Goldstein Research Source: Goldstein Research World wide acceptance of cloud based technologies and solutions are advancing the smart transportation technology. Automotive industry is adopting cloud technology for navigation, infotainment, social connection etc. Moreover, storage of data is enhancing the qualitative analysis of current transportation infrastructure and helps in implementation of smart technologies. The market of smart transportation business is driven due to upsurge in the demand for improvement in public transport facilities and safety. Latin America and Middle East & Africa together are projected to hold approximately XX% share of smart transportation market in 2024. Number of auto-sale is increased in Brazil and Mexico from past few decades. However due to lack of efficient transport infrastructure and awareness among population is limiting the market for smart transportation in the region. Copyright All Rights Reserved, Goldstein Research www.goldsteinresearch.com
6.1.4 Africa Automobile New Sales & Used Vehicles (Million Units), 2016 Indicator Ethiopia South Africa Nigeria Kenya Fleet Size XX XX XX XX Sales of New Vehicles XX XX XX XX Request Full Market Report Sample Commercial Vehicles (% New Sales) XX XX XX XX New Vehicles (% Total Fleet) XX XX XX XX Second Hand Vehicles (% Total Fleet) XX XX XX XX Motorization Rate (/1000 People) XX XX XX XX Source: Goldstein Research Copyright All Rights Reserved, Goldstein Research www.goldsteinresearch.com
6.2.1 Africa Smart Transportation Market Size (USD Billion) & Y-O-Y growth (%),2016-2024 Fig: 7-12 Africa Smart Transportation Market Share By Application, 2016-2024 Fig: 6-11Africa Smart Transportation Market Size(USD Billion)-2016- 2024 Vehicle Management XX% XX XX XX CAGR: (2016-2024) Mobility Management XX XX% XX XX% XX XX% XX Traffic Management XX% XX% XX XX% XX XX% XX XX% Request Full Market 2024 2016 Parking Management XX% Report Sample XX% Safety Assistance XX% XX% Others( Driver assistance, Infotainment, Well being) 2016e 2017e 2018f 2019f 2020f 2021f 2022f 2023f 2023f 2024f Source: Goldstein Research Source: Goldstein Research Fig: 6-14 Africa Smart Transportation Market Size (%), By Telematic Devices Type-2016-2024 Fig: 6-13 Africa Smart Transportation Market Size (USD Millions), By Country-2016-2024 XX XX XX XX XX XX XX XX XX XX XX XX XX XX XX XX 2016 2024 2016 2024 Vehicle Management Mobility Management Traffic Management Nigeria South Africa Source: Goldstein Research Source: Goldstein Research Copyright All Rights Reserved, Goldstein Research www.goldsteinresearch.com
6.7.2. The Transport Sector In Africa: Significance, Trends And Emerging Issues Road construction and maintenance standards are not uniform for all African countries. Whereas few countries have relatively adequate financial and human resources to build roads and maintain them to international standards, many African countries are not in position to do so. Road transport is the most dominant mode of motorized transport in Africa, accounting for 80% of the goods and 90% of the passenger traffic within the continent. Request Full Market Report Sample The importance of maritime transport emanates from the fact that over 90% of the world international trade transits through ports. Maritime transport is even more dominant in Africa as it accounts for 92% to 97% of Africa’s international trade. However, poorly maintained poorly infrastructure and inefficient operations remain major bottlenecks for African trade. Africa’s share of global air transport services remains modest at about 5.2% of the two billion passengers carried by 190 Member States of ICAO and approximately 3.6% of freight for the year 2006. Africa had about 4,000 airports and airfields in 2007, of which only 20% had paved runways. The vast majority of airports serve only smaller aircrafts for domestic services. A significant number of Africa’s airports do not meet ICAO standards and recommended practices. The railways connectivity is very low. In 2005 Africa had a total railway network of 90,320 km or 3.1 km of per 1,000 sq. km. The relative importance of the rail system compared to other modes is the advantage it has gained from recent economic and technological trends including higher energy prices, the growth of container stations and new increases in flows of bulk trade and traffic. However, the railways in Africa carry only 1% of the global railway passenger traffic and 2% of the goods traffic. Copyright All Rights Reserved, Goldstein Research www.goldsteinresearch.com
7. Porter’s Five Force Model Barriers to Entry Customer can easily switch to substitute products. So substitutes are a threat to your company. When there are actual and potential substitute products available then segment is unattractive. Profits and prices are effected by substitutes so, there is need to closely monitor price trends. In substitute industries, if competition rises or technology modernizes then prices and profits decline. The Barriers to Entry are significantly high which means that it is difficult for outside companies to enter the industry. New entrant is require to offer the innovative and distinguish service or product in order to make place in the competitive space, only such a player tends to establish its market presence and obtain the necessary clearance from regulatory agencies and obtain the profit. Request Full Market Report Sample HIGH High Cost Manufacturing, Well Established Players. Threat of new entrants Bargaining Power of buyers Bargaining power of suppliers Industry Competitors: Supplier Power: Buyer Power: HIGH HIGH LOW IBM, Cisco, Qualcomm, etc Intensity of competition among the existing competitors in the market. Intensity of rivalry depends on the number of competitors and their capabilities. Industry rivalry is high when: •There are number of small or equal competitors and less when there’s a clear market leader. •Customers have low switching costs •Industry is growing •Exit barriers are high and rivals stay and compete •Fixed cost are high resulting huge production and reduction in prices Threat of substitute products or services The power of Buyers is significantly low and they are able to negotiate for better pricing. However on the supplier side, the power of Suppliers is high as there are multiple supplier for a particular test and these causes, for companies to compete on price when they do not have any point of differentiation. Substitutes: LOW Copyright All Rights Reserved, Goldstein Research www.goldsteinresearch.com
8.1.2. IBM Corporation (Financial Analysis) Fig: 8-1 IBM-Revenue (USD Billion), 2013-2015 Key Takeaways From a geographic perspective, revenue in the major markets in 2014 declined by XX percent due to currency and divestitures Moreover, the market of Asia-Pacific declines in 2015 but the revenue is corrected by the growth in Latin America and Middle-East & Africa The total consolidated revenue decreased by XX% in 2015 due to adjusted for currency and acquisition of The Weather Company XX Revenue (USD Billion) XX XX Request Full Market Report Sample XX 2013 2014 2015 2016 Source: Annual Report Table No. 1 Key Financials 2014 2015 Operating Margin XX% XX% Net Profit Margin XX% XX% Debt to Asset XX XX Market Capitalization USD XX Million USD XX Million Source: Google finance, Morningstar Copyright All Rights Reserved, Goldstein Research www.goldsteinresearch.com
8.2.1.Qualcomm (Financial Analysis) Founded 1972 Employees 30,500 Website Headquarters U.S. www.qualcomm.com Company Overview Business Segments Request Full Market Report Sample Qualcomm telecommunications equipment company that designs and markets wireless telecommunications products and services The Company is traded on American Stock Exchange (NASDAQ) QUALCOMM Incorporated is engaged commercialization of a digital communication technology called code division multiple access (CDMA) The Company is engaged in the development and commercialization of the orthogonal frequency division multiple access (OFDMA) family of technologies, including long-term evolution (LTE) is an American multinational semiconductor and Qualcomm CDMA Technologies Qualcomm Technology Licensing in the development and Qualcomm Strategic Initiatives Hardware Networking Equipment Business Strategy Advancement: Qualcomm Developer Network is fuelling innovation across the Internet of Things (IoT), giving developers access to the tools they need to create connected applications, experiences, and devices. Qualcomm introduced its own IoT platform to provide ease to the users to manage and analyze the data generated through connected devices. Moreover, the company is also investing hugely in growing Internet of Things (IoT) companies such as Placemeter, Whistle, August, 21 Inc., Flip Technologies and others. On the other hand, the company acquired technology firms to retain its growth in the global market by launching advanced and innovative products Copyright All Rights Reserved, Goldstein Research www.goldsteinresearch.com
Vision Value Visibility About Us Based in U.S., Goldstein Research is a young business consulting and market research firm with vast reach across America, Asia and parts of Europe and the Middle East. In the next five years, we strive to expand our reach to 50+ nations spanning across Europe, Asia and parts of the Middle East and Africa. We strive to realize a strong brand presence globally through our quality research and forecasting Request Full Market Report Sample solutions. With 30+ domain experts and 50+ employees working day and night to crunch numbers and bring out the best and detailed market reports and forecasts, we strive to enable you to foresee upcoming market challenges and develop a robust business model and strategies, which would add to your profitability and market visibility as a brand. Our mission is simple: to develop insightful business solutions, help our clients make powerful future decisions to keep them well ahead of the game which is the market, and leave a mark across businesses and communities through our well-defined ideas and clear cut forecasts. Our mission is simple: to develop insightful business solutions, help our clients make powerful future decisions to keep them well ahead of the game which is the market, and leave a mark across businesses and communities through our well-defined ideas and clear cut forecasts. Published By: Goldstein Research Copyright All Rights Reserved, Goldstein Research www.goldsteinresearch.com
Request Full Market Report Sample Thank you Thank you Connect With Us: Published By: Goldstein Research Copyright All Rights Reserved, Goldstein Research www.goldsteinresearch.com