Download
1 / 6
60 likes | 157 Views
The main aim of this research study was to evaluate the impact of human energy treatment on the physical, thermal and spectral properties of O-Aminophenol. For more details visit the link.<br>

E N D
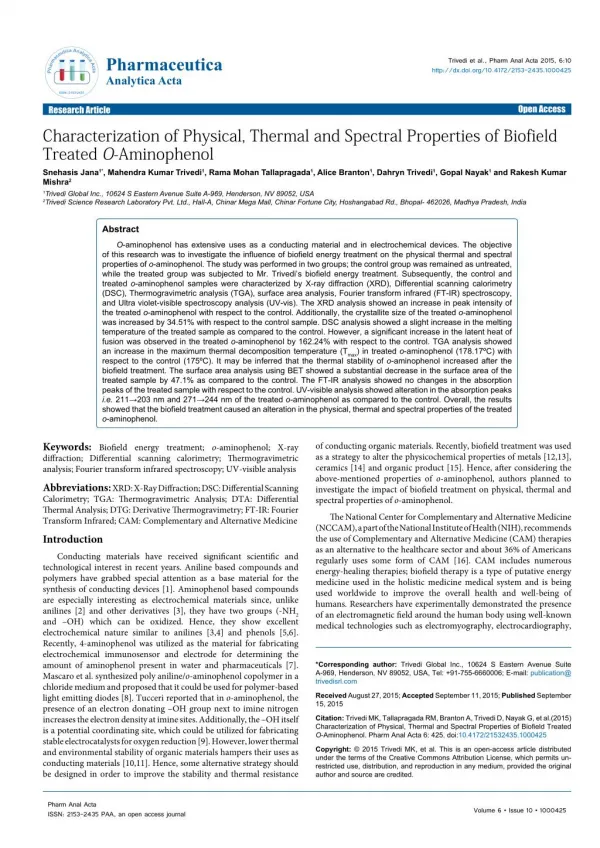
PharmaceuticaAnalyticaActa Pharmaceutica Analytica Acta Trivedi et al., Pharm Anal Acta 2015, 6:10 http://dx.doi.org/10.4172/2153-2435.1000425 ISSN: 2153-2435 Open Access Research Article Characterization of Physical, Thermal and Spectral Properties of Biofield Treated O-Aminophenol Snehasis Jana1*, Mahendra Kumar Trivedi1, Rama Mohan Tallapragada1, Alice Branton1, Dahryn Trivedi1, Gopal Nayak1 and Rakesh Kumar Mishra2 1Trivedi Global Inc., 10624 S Eastern Avenue Suite A-969, Henderson, NV 89052, USA 2Trivedi Science Research Laboratory Pvt. Ltd., Hall-A, Chinar Mega Mall, Chinar Fortune City, Hoshangabad Rd., Bhopal- 462026, Madhya Pradesh, India Abstract O-aminophenol has extensive uses as a conducting material and in electrochemical devices. The objective of this research was to investigate the influence of biofield energy treatment on the physical thermal and spectral properties of o-aminophenol. The study was performed in two groups; the control group was remained as untreated, while the treated group was subjected to Mr. Trivedi’s biofield energy treatment. Subsequently, the control and treated o-aminophenol samples were characterized by X-ray diffraction (XRD), Differential scanning calorimetry (DSC), Thermogravimetric analysis (TGA), surface area analysis, Fourier transform infrared (FT-IR) spectroscopy, and Ultra violet-visible spectroscopy analysis (UV-vis). The XRD analysis showed an increase in peak intensity of the treated o-aminophenol with respect to the control. Additionally, the crystallite size of the treated o-aminophenol was increased by 34.51% with respect to the control sample. DSC analysis showed a slight increase in the melting temperature of the treated sample as compared to the control. However, a significant increase in the latent heat of fusion was observed in the treated o-aminophenol by 162.24% with respect to the control. TGA analysis showed an increase in the maximum thermal decomposition temperature (Tmax) in treated o-aminophenol (178.17ºC) with respect to the control (175ºC). It may be inferred that the thermal stability of o-aminophenol increased after the biofield treatment. The surface area analysis using BET showed a substantial decrease in the surface area of the treated sample by 47.1% as compared to the control. The FT-IR analysis showed no changes in the absorption peaks of the treated sample with respect to the control. UV-visible analysis showed alteration in the absorption peaks i.e. 211→203 nm and 271→244 nm of the treated o-aminophenol as compared to the control. Overall, the results showed that the biofield treatment caused an alteration in the physical, thermal and spectral properties of the treated o-aminophenol. Keywords: Biofield energy treatment; o-aminophenol; X-ray diffraction; Differential scanning calorimetry; Thermogravimetric analysis; Fourier transform infrared spectroscopy; UV-visible analysis Abbreviations: XRD: X-Ray Diffraction; DSC: Differential Scanning Calorimetry; TGA: Thermogravimetric Analysis; DTA: Differential Thermal Analysis; DTG: Derivative Thermogravimetry; FT-IR: Fourier Transform Infrared; CAM: Complementary and Alternative Medicine Introduction Conducting materials have received significant scientific and technological interest in recent years. Aniline based compounds and polymers have grabbed special attention as a base material for the synthesis of conducting devices [1]. Aminophenol based compounds are especially interesting as electrochemical materials since, unlike anilines [2] and other derivatives [3], they have two groups (-NH2 and –OH) which can be oxidized. Hence, they show excellent electrochemical nature similar to anilines [3,4] and phenols [5,6]. Recently, 4-aminophenol was utilized as the material for fabricating electrochemical immunosensor and electrode for determining the amount of aminophenol present in water and pharmaceuticals [7]. Mascaro et al. synthesized poly aniline/o-aminophenol copolymer in a chloride medium and proposed that it could be used for polymer-based light emitting diodes [8]. Tucceri reported that in o-aminophenol, the presence of an electron donating –OH group next to imine nitrogen increases the electron density at imine sites. Additionally, the –OH itself is a potential coordinating site, which could be utilized for fabricating stable electrocatalysts for oxygen reduction [9]. However, lower thermal and environmental stability of organic materials hampers their uses as conducting materials [10,11]. Hence, some alternative strategy should be designed in order to improve the stability and thermal resistance of conducting organic materials. Recently, biofield treatment was used as a strategy to alter the physicochemical properties of metals [12,13], ceramics [14] and organic product [15]. Hence, after considering the above-mentioned properties of o-aminophenol, authors planned to investigate the impact of biofield treatment on physical, thermal and spectral properties of o-aminophenol. The National Center for Complementary and Alternative Medicine (NCCAM), a part of the National Institute of Health (NIH), recommends the use of Complementary and Alternative Medicine (CAM) therapies as an alternative to the healthcare sector and about 36% of Americans regularly uses some form of CAM [16]. CAM includes numerous energy-healing therapies; biofield therapy is a type of putative energy medicine used in the holistic medicine medical system and is being used worldwide to improve the overall health and well-being of humans. Researchers have experimentally demonstrated the presence of an electromagnetic field around the human body using well-known medical technologies such as electromyography, electrocardiography, *Corresponding author:Trivedi Global Inc., 10624 S Eastern Avenue Suite A-969, Henderson, NV 89052, USA, Tel: +91-755-6660006; E-mail: publication@ trivedisrl.com ReceivedAugust 27, 2015; AcceptedSeptember 11, 2015; PublishedSeptember 15, 2015 Citation: Trivedi MK, Tallapragada RM, Branton A, Trivedi D, Nayak G, et al.(2015) Characterization of Physical, Thermal and Spectral Properties of Biofield Treated O-Aminophenol. Pharm Anal Acta 6: 425. doi:10.4172/21532435.1000425 Copyright: © 2015 Trivedi MK, et al. This is an open-access article distributed under the terms of the Creative Commons Attribution License, which permits un- restricted use, distribution, and reproduction in any medium, provided the original author and source are credited. Pharm Anal Acta ISSN: 2153-2435 PAA, an open access journal Volume 6 • Issue 10 • 1000425
Citation: Trivedi MK, Tallapragada RM, Branton A, Trivedi D, Nayak G, et al.(2015)Characterization of Physical, Thermal and Spectral Properties of Biofield Treated O-Aminophenol. Pharm Anal Acta 6: 425. doi:10.4172/21532435.1000425 Page 2 of 6 and the electroencephalogram [17]. Additionally, it also showed that bioelectricity generated from the heart, brain functions or due to the motion of charged particles such as protons, electrons, and ions in the human body [18]. Thus, the human body emits electromagnetic waves in the form of bio-photons, which surrounds the body, i.e., commonly known as a biofield. Therefore, a human has the ability to harness the energy from the environment/Universe and then transmit it to any object (living or non-living) around the globe. The object(s) always receive the energy and respond into a useful way. This energy is called biofield energy, and this process is referred to as biofield treatment. Mr. Trivedi’s unique biofield energy treatment is also known as The Trivedi Effect®. This biofield treatment is known to alter the characteristics of many living organisms and nonliving materials in various research fields such as agriculture research [19,20] and biotechnology research [21]. Biofield treatment has shown excellent results in improving the antimicrobial susceptibility pattern, alteration of biochemical reactions, as well as induced alterations in the characteristics of pathogenic microbes [22,23]. Exposure to biofield treatment caused paramount increase in the medicinal property, growth, and anatomical characteristics of ashwagandha [24]. Moreover, biofield treatment has been used as an excellent strategy for the modification of spectral properties of various pharmaceutical drugs like paracetamol and piroxicam [25]. After considering the above-mentioned excellent results obtained through biofield treatments, this work was undertaken to evaluate the impact of biofield treatment on the physical, thermal and spectral properties of o-aminophenol. Materials and Methods O-aminophenol was procured from SD Fine Chemicals Limited, India. The sample was divided into two parts; one was kept as a control sample while the other was subjected to Mr. Trivedi’s unique biofield treatment and coded as the treated sample. The treated group was kept in a sealed pack and handed over to Mr. Trivedi for biofield treatment under controlled laboratory conditions. Mr. Trivedi provided the treatment through his energy transmission process to the treated group without touching the sample. The control and treated samples were characterized by XRD, DSC, TGA, surface area analysis, FT-IR, and UV-visible analysis. Characterization X-ray diffraction (XRD) study XRD analysis of the control and treated o-aminophenol was carried out on Phillips, Holland PW 1710 X-ray diffractometer system, which had a copper anode with nickel filter. The radiation of wavelength used by the XRD system was 1.54056 Å. The data obtained from this XRD were in the form of a chart of 2θ vs. intensity and a detailed table containing peak intensity counts, d value (Å), peak width (θ°), relative intensity (%) etc. The crystallite size (G) was calculated by using formula: G = kλ/(bCosθ) Here, λ is the wavelength of radiation used, b is full width half- maximum (FWHM) of peaks and k is the equipment constant (=0.94). The percentage change in crystallite size was calculated using following formula: Percentage change in crystallite size = [(Gt-Gc)/Gc] ×100 Where, Gc and Gt are crystallite size of control and treated powder samples respectively. Differential scanning calorimetry (DSC) DSC was used to investigate the melting temperature and latent heat of fusion (∆H) of samples. The control and treated o-aminophenol samples were analyzed using a Pyris-6 Perkin Elmer DSC at a heating rate of 10ºC/min under air atmosphere and the air was flushed at a flow rate of 5 mL/min. Predetermined amount of sample was kept in an aluminum pan and closed with a lid. A blank aluminum pan was used as a reference. Percentage change in latent heat of fusion was calculated using following equations: [ % change in Surface area S ] − Treated S S = × Control 100 Control Where, ΔH Control and ΔH Treated are the latent heat of fusion of control and treated samples, respectively. Thermogravimetric analysis-differential thermal analysis (TGA-DTA) Thermal stability of control and treated o-aminophenol were analyzed by using Mettler Toledo simultaneous TGA and Differential thermal analyzer (DTA). The samples were heated from room temperature to 400ºC with a heating rate of 5ºC/min under air atmosphere. Surface area analysis Surface area of o-aminophenol were characterized by surface area analyzer, SMART SORB 90 Brunauer-Emmett-Teller (BET) using ASTM D 5604 method which had a detection range of 0.2-1000 m2/g. Percent changes in surface area were calculated using following equation: [ % change in Surface area S Where, S Control and S Treated are the surface area of control and treated samples respectively. FT-IR spectroscopy FT-IR spectra were recorded on Shimadzu’s Fourier transform infrared spectrometer (Japan) with frequency range of 4000-500 cm-1. The analysis was accomplished to evaluate the effect of biofield treatment at atomic level like dipole moment, force constant and bond strength in chemical structure [26]. The treated sample was divided into two parts T1 and T2 for FT-IR analysis. UV-Vis spectroscopic analysis UV spectra of control and treated o-aminophenol samples were recorded on Shimadzu UV-2400 PC series spectrophotometer with 1 cm quartz cell and a slit width of 2.0 nm. The analysis was carried out using wavelength in the range of 200-400 nm and methanol was used as solvent. The UV spectra was analyzed to determine the effect of biofield treatment on the energy gap of highest occupied molecular orbital and lowest unoccupied molecular orbital (HOMO–LUMO gap) [26]. The treated sample was divided in two parts T1 and T2 for the analysis. Results and Discussion XRD study XRD diffractogram of the control and treated o-aminophenol are shown in Figure 1. XRD diffractogram of the control sample showed ] − Treated S S = × Control 100 Control Pharm Anal Acta ISSN: 2153-2435 PAA, an open access journal Volume 6 • Issue 10 • 1000425
Citation: Trivedi MK, Tallapragada RM, Branton A, Trivedi D, Nayak G, et al.(2015)Characterization of Physical, Thermal and Spectral Properties of Biofield Treated O-Aminophenol. Pharm Anal Acta 6: 425. doi:10.4172/21532435.1000425 Page 3 of 6 crystalline peaks at 2θ equal to 17.93º, 18.73º, 18.87º, 26.04º, and 45.85º. However, the XRD of treated sample showed intense peaks at 2θ equal to 17.92º, 18.68º, 18.87º, 26.15º and 45.88º. The result showed a substantial increase in the intensity of few XRD peaks at 2θ equal to 17.92º, 18.87º and 45.88º in treated o-aminophenol with respect to control. The increase in the intensity of the XRD peak may be due to increase in a long-range symmetrical pattern of treated o-aminophenol molecules that lead to the enhanced crystallinity of the sample. Crystallite size was calculated using the Scherrer formula (crystallite size = kλ /b cos θ) and the results are presented in Figure 2. The crystallite size of control o-aminophenol was 78.32 nm, and it was increased significantly to 105.35 nm in the treated sample. The percentage increase in crystallite size was 34.51% in treated o-aminophenol with respect to the control. It was reported previously that increase in annealing temperature significantly affects the crystallite size of the materials. The increase in temperature causes decrease in dislocation density and increase in number of unit cell that ultimately causes an increase in crystallite size [27,28]. It is hypothesized that biofield treatment may provide some thermal energy that possibly cause a reduction in dislocation density and increase in number of unit cell and crystallite size of the treated o-aminophenol as compared to the control. DSC study DSC thermogram of the control and treated samples are presented in Figure 3. DSC thermogram of the control o-aminophenol showed the presence of an endothermic sharp inflection at 176.07ºC, which was due to melting temperature of the sample. However, the treated o-aminophenol showed an endothermic peak at 176.75ºC, which corresponded to melting temperature of the treated sample. This 100 80 Crystallite size (nm) 60 40 20 0 Control Treated Figure 2: Crystallite size of control and treated o-aminophenol. showed the slight change in the melting temperature of treated o-aminophenol with respect to control. It was previously reported that intermolecular hydrogen bonding increases the melting point of the compounds [29]. Hence, it is assumed that the biofield treatment might increase the hydrogen bonding in treated o-aminophenol that leads to increasing in melting temperature of the sample. The latent heat of fusion was obtained from the respective thermogram of control and treated o-aminophenol and data are presented in Table 1. The control o-aminophenol showed a latent heat of fusion of 262.5 J/g and it was significantly increased to 688.37 J/g in treated sample. The result showed 162.24% increase in latent heat of fusion in the treated o-aminophenol as compared to control. It was previously reported that amount of thermal energy employed in phase change from solid to the liquid state of the unit mass of material is known as latent heat of fusion (∆H). It is hypothesized that biofield treatment of treated o-aminophenol may cause absorption of more energy during the phase transition from solid to the liquid that might lead to increasing in latent heat of fusion with respect to the control sample. TGA-DTA analysis TGA was conducted to investigate the thermal stability of the control and treated o-aminophenol. TGA thermogram of the control and treated o-aminophenol are depicted in Figure 4. TGA thermogram of the control o-aminophenol showed a one-step thermal degradation pattern. The thermal degradation started at around 161ºC and terminated at around 194ºC. During this event, the control sample lost about 48.39% of its initial weight. On the other hand the treated o-aminophenol also displayed one-step thermal degradation pattern. The treated sample started losing weight around 158ºC, and this process terminated at around 212ºC. During this event, the treated sample lost around 55.98% of its initial weight. DTA thermogram of the control and treated o-aminophenol are shown in Figure 4. DTA thermogram of the control o-aminophenol showed an endothermic peak at 176.09ºC, which corresponded to its melting temperature. However the treated o-aminophenol displayed an endothermic peak at 176.92ºC, due to the melting temperature of the treated sample. This showed a slight change in melting temperature of the treated o-aminophenol that was well supported by DSC analysis. DTG thermogram of the control and treated o-aminophenol are shown in Figure 4. The DTG thermogram of control o-aminophenol showed a maximum thermal decomposition temperature (Tmax) at Figure 1: XRD diffractogram of control and treated o-aminophenol. Pharm Anal Acta ISSN: 2153-2435 PAA, an open access journal Volume 6 • Issue 10 • 1000425
Citation: Trivedi MK, Tallapragada RM, Branton A, Trivedi D, Nayak G, et al.(2015)Characterization of Physical, Thermal and Spectral Properties of Biofield Treated O-Aminophenol. Pharm Anal Acta 6: 425. doi:10.4172/21532435.1000425 Page 4 of 6 Surface area analysis The surface area was investigated for the control and treated o-aminophenol using BET method and results are presented in Figure 5. The control o-aminophenol showed surface area of 0.3845 m2/g and it was decreased significantly to 0.2034 m2/g in the treated o-aminophenol. The result showed 47.1% decrease in surface area of the treated o-aminophenol with respect to the control. It is assumed that biofield treatment may induce disappearance of internal boundaries of particles that led to aggregation and increase in particle size. Presumably this increase in particle size might lead to a decrease in surface area of the treated samples. FT-IR spectroscopy FT-IR spectra of the control and treated o-aminophenol (T1 and T2) are presented in Figure 6. FT-IR spectrum of the control o-aminophenol showed characteristic absorption peaks at 3304- 3375 cm-1 due to hydrogen bonded –OH/-NH stretching vibrations. Vibration peaks at 2991-3020 cm-1 were due to –CH stretching vibration peaks in the control sample. The absorption peak at 1604 cm-1 was due to N-H bending of aromatic amine and C=C group stretching. Absorption peak at 1512 cm-1 was due to C-C in ring stretching vibration peak. Vibration peaks for C-O were observed at 1031-1085 cm-1 and C-N stretching peaks were observed at 1269-1282 cm-1. FT-IR spectrum of the treated o-aminophenol (T1) showed absorption bands at 3306-3375 cm-1 that corresponded to phenolic – OH/–NH stretching vibration peaks. –CH stretching vibration peaks were observed at 2989-3022 cm-1 in the T1 sample. Vibration peak for N-H- bending and typical C=C stretching were observed at 1604 cm-1. Absorption peak at 1512 cm-1 was due to C-C in ring stretching vibration peak. Vibration peaks for C-O and C-N stretching were observed at 1085-1031 cm-1 and 1269-1282 cm-1, respectively. Whereas, the FT-IR spectrum of o-aminophenol (T2) showed –OH/-NH stretching vibration peaks at 3306-3377 cm-1. The –CH stretching vibration peaks were observed at 2989-3022 cm-1 in the T2 sample. Vibration peak at 1604 cm-1 was due to N-H bending and C=C ring stretching. Absorption peak at 1512 cm-1 was due to C-C in ring stretching vibration peak. C-O and C-N stretching vibration peaks were observed at 1031-1085 cm-1 and 1269-1282 cm-1, respectively. The FT-IR peaks were well supported by literature data [31]. Overall, the FT-IR results showed no changes in absorption peak of the treated o-aminophenol with respect to the control sample. UV-visible spectroscopy UV spectra of the control and treated sample are presented in Figure 7. The UV spectrum of control o-aminophenol showed three absorption peaks, i.e., 291, 271, and 211 nm. Contrarily, the UV spectrum of the treated o-aminophenol (T1) showed two absorption peaks, i.e., 247 and 206 nm. Whereas, the treated o-aminophenol (T2) showed three absorption peaks at 295, 244 and 203 nm. It was reported that absorption peaks between 210-290 nm were mainly due to n→ π* and π - π* transition of the aromatic rings [29]. The result showed a downward shift of 211 nm absorption peak of the control sample to 203 nm in the treated o-aminophenol (T2) sample. Additionally a significant shift in UV absorption 271→244 nm was observed in the treated o-aminophenol (T2) sample with respect to the control. The alteration in UV absorption peaks in the treated o-aminophenol (T2) was due to the transition of electron i.e. bonding (n→ π* and π→π* transition) from the ground state to excited state. Therefore, it is hypothesized that biofield treatment may cause an alteration in Parameter Latent heat of fusion ΔH (J/g) Melting temperature (ºC) Tmax (ºC) Weight loss (%) Control 262.50 176.07 175.00 48.39 Treated 688.37 176.75 178.17 55.98 Table 1: Thermal analysis data of control and treated o-aminophenol. Figure 3: DSC thermogram of control and treated o-aminophenol. 175ºC. Nevertheless, the treated o-aminophenol showed an increase in Tmax temperature and it was observed at 178.17ºC. This increase in Tmax of treated o-aminophenol may be inferred as an increase in thermal stability as compared to the control sample. According to Boltzman law of energy distribution among molecules at any temperature a portion of molecules will possess energy higher than the bond energy. K=Ae-E/RT Where, A is the frequency factor related to the vibration frequency of a critical mode of vibration in molecules, and E is the excess energy that must be concentrated in the molecule to decompose it. K is the rate of decomposition. It was reported that A should be minimized to increase the thermal stability of the organic compounds [30]. Hence, it is assumed that the biofield treatment may be acted on the treated o-aminophenol and minimized the frequency of critical mode of vibration of molecules that leads to increase the thermal stability of treated sample with respect to control. Therefore the high thermal stability of treated o-aminophenol could improve its application as conducting materials. Pharm Anal Acta ISSN: 2153-2435 PAA, an open access journal Volume 6 • Issue 10 • 1000425
Citation: Trivedi MK, Tallapragada RM, Branton A, Trivedi D, Nayak G, et al.(2015)Characterization of Physical, Thermal and Spectral Properties of Biofield Treated O-Aminophenol. Pharm Anal Acta 6: 425. doi:10.4172/21532435.1000425 Page 5 of 6 Figure 6: FT-IR spectra of control and treated (T1 and T2) o-aminophenol. Figure 4: TGA thermogram of control and treated o-aminophenol. 0.4 0.35 0.3 Surface area (m2/g) 0.25 0.2 0.15 0.1 0.05 0 Control Treated Figure 5: Surface area of control and treated o-aminophenol. bonding electron transition of the treated sample with respect to the control. Conclusion The XRD analysis showed an increase in the intensity of peaks in the treated o-aminophenol with respect to the control. The crystallite size significantly increased in the treated compound as compared to the control o-aminophenol. The biofield treatment may have caused a reduction in the dislocation density and an increase in unit cell that led to the increase in crystallite size. DSC and DTA showed a change in the melting temperature of the treated compound with respect to the control. A substantial increase in the latent heat of fusion was observed in the treated o-aminophenol by 162.24% after receiving the biofield treatment with respect to the control. TGA analysis showed an increase in the thermal stability of the treated compound as compared to the Figure 7: UV visible spectra of control and treated (T1 and T2) o-aminophenol. Pharm Anal Acta ISSN: 2153-2435 PAA, an open access journal Volume 6 • Issue 10 • 1000425
Citation: Trivedi MK, Tallapragada RM, Branton A, Trivedi D, Nayak G, et al.(2015)Characterization of Physical, Thermal and Spectral Properties of Biofield Treated O-Aminophenol. Pharm Anal Acta 6: 425. doi:10.4172/21532435.1000425 Page 6 of 6 control. Surface area analysis showed a substantial decrease in the surface area of the treated o-aminophenol as compared to the control. FT-IR analysis showed no significant changes in the FT-IR spectra of the treated sample as compared to the control. However, the UV-visible analysis showed alterations in the bonding π - π* transition in the aromatic ring of the treated sample with respect to the control. Overall, the results demonstrated that the biofield treatment influenced the physical, thermal and spectral properties of the treated o-aminophenol. Hence, the high thermal stability of the treated o-aminophenol could make it a potential candidate for the fabrication of electrochemical and conducting devices. 17. Movaffaghi Z, Farsi M (2009) Biofield therapies: biophysical basis and biological regulations? Complement Ther Clin Pract 15: 35-37. 18. Neuman MR (2000) Biopotential electrodes. The biomedical engg handbook: (2ndedition), Boca Raton: CRC Press LLC. 19. Shinde V, Sances F, Patil S, Spence A (2012) Impact of biofield treatment on growth and yield of lettuce and tomato. Aust J Basic Appl Sci 6: 100-105. 20. Sances F, Flora E, Patil S, Spence A, Shinde V (2013) Impact of biofield treatment on ginseng and organic blueberry yield. Agrivita J Agric Sci 35: 22- 29. 21. Patil SA, Nayak GB, Barve SS, Tembe RP, Khan RR (2012) Impact of biofield treatment on growth and anatomical characteristics of Pogostemon cablin (Benth.). Biotechnology 11: 154-162. Acknowledgement 22. Trivedi MK, Patil S, Shettigar H, Bairwa K, Jana S (2015) Phenotypic and biotypic characterization of Klebsiella oxytoca: An impact of biofield treatment. J Microb Biochem Technol 7: 203-206. The authors would like to thank Trivedi Science, Trivedi Master Wellness and Trivedi Testimonials for their support during this research work. Authors would also like to thanks the whole team from the MGV pharmacy college, Nashik for providing the instrumental facility. 23. Trivedi MK, Patil S, Shettigar H, Gangwar M, Jana S (2015) An effect of biofield treatment on Multidrug-resistant Burkholderia cepacia: A multihost pathogen. J Trop Dis 3: 167. References 24. Nayak G, Altekar N (2015) Effect of biofield treatment on plant growth and adaptation. J Environ Health Sci 1: 1-9. 1. Nabid MR, Entezami AA (2003) Enzymatic synthesis and characterization of a water-soluble, conducting poly (o-toluidine). Eur Polym J 39: 1169-1175. 25. Trivedi MK, Patil S, Shettigar H, Bairwa K, Jana S (2015) Effect of biofield treatment on spectral properties of paracetamol and piroxicam. Chem Sci J 6: 98. 2. Yang H, Bard AJ (1992) The application of fast scan cyclic voltammetry. Mechanistic study of the initial stage of electropolymerization of aniline in aqueous solutions. J Electroanal Chem 339: 423-449. 26. Pavia DL, Lampman GM, Kriz GS (2001) Introduction to spectroscopy. (3rd edition), Thomson Learning, Singapore. 3. Yamada K, Teshima K, Kobayashi N, Hirohashi R (1995) Electropolymerization of aniline derivatives in non-aqueous solution without a proton donor. J Electroanal Chem 394: 71-79. 27. Gaber A, Abdel-Rahim MA, Abdel-Latief AY, Abdel-Salam MN (2014) Influence of calcination temperature on the structure and porosity of nanocrystalline SnO2 synthesized by a conventional precipitation method. Int J Electrochem Sci 9: 81-95. 4. Chiang JC, MacDiarmid AG (1986) ‘Polyaniline’: Protonic acid doping of the emeraldine form to the metallic regime. Synt Met 13: 193-205. 5. Gattrell M, Kirk DW (1992) A Fourier transform infrared spectroscopy study of the passive film produced during aqueous acidic phenol electro-oxidation. J Electrochem Soc 139: 2736-2744. 28. Raj KJA, Viswanathan B (2009) Effect of surface area, pore volume, particle size of P25 titania on the phase transformation of anatase to rutile. Indian J Chem 48A: 1378-1382. 6. Lapuente R, Cases F, Garces P, Morallon E Vazquez JL (1998) A voltammetric and FT-IR–ATR study of the electropolymerization of phenol on platinum electrodes in carbonate medium: Influence of sulfide. J Electroanal Chem 451: 163-171. 29. Cinarli A, Gurbuz D, Tavman A, Birteksoz AS (2011) Synthesis, spectral characterizations and antimicrobial activity of some schiff bases of 4-chloro-2- aminophenol. Bull Chem Soc Ethiop 25: 407-417. 30. Johns IB, McElhill EA, Smith JO (1962) Thermal stability of organic compounds. Ind Eng Chem Prod Res Dev 1: 2-6. 7. Yin H, Ma Q, Zhou Y, Ai S, Zhu L (2010) Electrochemical behavior and voltammetric determination of 4-aminophenol based on graphene-chitosan composite film modified glassy carbon electrode. Electrochim Acta 55: 7102- 7108. 31. Thenmozhi G, JayaKumar D, Gopalswamy M, Jaya Santhi R (2011) Synthesis, characterisation and biological applications of conducting poly (p- amino phenol) and its nano compound. Der Pharma Chemica 3: 116-126. 8. Mascaro LH, Berton AN, Micaron L (2011) Electrochemical synthesis of polyaniline/poly-o-aminophenol copolymers in chloride medium. Int J of Electrochem 2011: Article ID 292581. 9. Tucceri R (2013) Poly (o-aminophenol) Film electrodes: Synthesis, transport properties and practical applications. Springer science and business media. 10. Li Y, Qian R (1993) Stability of conducting polymers from the electrochemical point of view. Synt Met 53: 149-154. 11. Wang Y, Rubner MF, Buckley LJ (1991) Stability studies of electrically conducting polyheterocycles. Synt Met 41: 1103-1108. 12. Trivedi MK, Patil S, Tallapragada RM (2013) Effect of biofield treatment on the physical and thermal characteristics of silicon, tin and lead powders. J Material Sci Eng 2: 125. 13. Trivedi MK, Patil S, Tallapragada RMR (2015) Effect of biofield treatment on the physical and thermal characteristics of aluminium powders. Ind Eng Manag 4: 151. 14. Trivedi MK, Patil S, Tallapragada RM (2013) Effect of biofield treatment on the physical and thermal characteristics of vanadium pentoxide powder. J Material Sci Eng S11: 001. 15. Trivedi MK, Nayak G, Patil S, Tallapragada RM, Jana S, et al. (2015) Bio-field treatment: An effective strategy to improve the quality of beef extract and meat infusion powder. J Nutr Food Sci 5: 389. Citation: Trivedi MK, Tallapragada RM, Branton A, Trivedi D, Nayak G, et al.(2015)Characterization of Physical, Thermal and Spectral Properties of Biofield Treated O-Aminophenol. Pharm Anal Acta 6: 425. doi:10.4172/21532435.1000425 16. Barnes PM, Powell-Griner E, McFann K, Nahin RL (2004) Complementary and alternative medicine use among adults: United States, 2002. Adv Data: 1-19. Pharm Anal Acta ISSN: 2153-2435 PAA, an open access journal Volume 6 • Issue 10 • 1000425