Download
1 / 27
270 likes | 828 Views
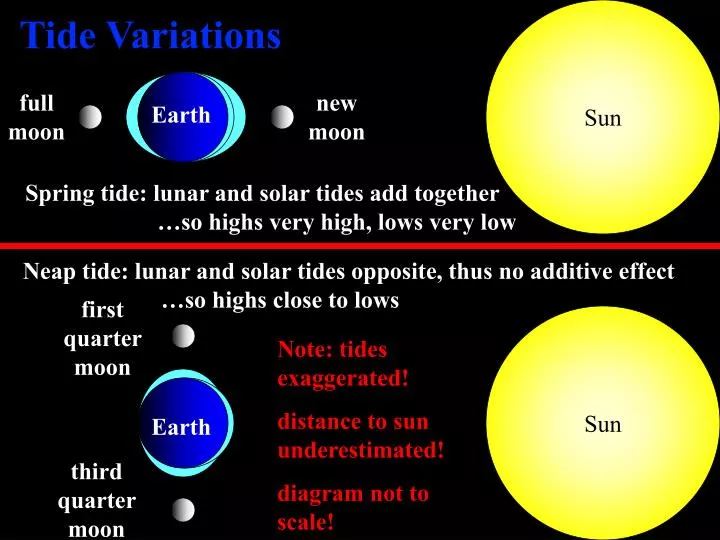
Sun. first quarter moon. Sun. Earth. third quarter moon. Tide Variations. full moon. new moon. Earth. Spring tide: lunar and solar tides add together …so highs very high, lows very low. Neap tide: lunar and solar tides opposite, thus no additive effect

E N D
Sun first quarter moon Sun Earth third quarter moon Tide Variations full moon new moon Earth Spring tide: lunar and solar tides add together …so highs very high, lows very low Neap tide: lunar and solar tides opposite, thus no additive effect …so highs close to lows Note: tides exaggerated! distance to sun underestimated! diagram not to scale!
Exaggerating Depths The thickness of this black line is 2 times the depth of the Mariana Trench and would also easily contain Mount Everest…more than all of the surface relief of the Earth! Earth Diameter: 12,756 km Mount Everest: 8.848 km Average Ocean Depth: Pacific 4.028 km Atlantic 3.926 Indian 3.963 Arctic 1.205 In fact, the black line would encompass both the depth of the Mariana Trench and also the Troposphere above it! Maximum Ocean Depth: Pacific 11.033 km Atlantic 9.219 Indian 7.455 Arctic 5.625 Atmosphere: 75% found in Troposphere 11.272 km Moon 3, 478 km Line Thickness: 26.247 km distance from Earth: 103 moon diameters!
Mean High Water Mean Low Water Extreme Low Water Tidal Zones Supralittoral Zone Splash Supralittoral Fringe Extreme High Water Extremes at Spring Tides Littoral Zone Midlittoral Zone Because San Salvador is located near the equator, the Littoral Zone may be quite thin, so wave height may be more important to organisms in the Littoral and Supralittoral Fringe Infralittoral Fringe Infralittoral Zone Limestone Marine Rock or Sloped Sandy Bottom
This tide table is provided from irbs.com/tides/calendar/month/4962.html?y=2007&m=5&d=22 San Salvador (Watling Island), Bahamas 24.05° N, 74.55° W All tides in ft relative to an index level…All times are EDT 2.02 2.38 1.91 1.71 1.60 1.56 1.58 1.70 1.77 1.84 1.86 1.60 Tide Table May-June 2007 Tidal Flux H-L spring neap spring-neap =0.82 ft = 9.8 in spring Comment: May-June Water Temperature 77-80°F = 25-26.6°C Shallow near-shore water may be warmer!
OceanicIslandEcology Ecology: study of organisms in environment
Where We Are… • Oceanic Island Forms • Provides Rich Habitat Diversity • Has Climate and Environmental Factors • Now we need the Organisms!
Trophic Pyramid 3° Consumer - Carnivore feeding on Carnivores 2° Consumer Carnivore Numbers Biomass Energy 1° Consumer Herbivore Producer Photosynthesis
Critical Thinking About This Video The theme was: the reef is green because of overfishing. Science decisions are based on objective evidence. What was the evidence for “greening”? Did you see green? What fish were you shown swimming on the reef? Dr. Booth has visited San Salvador over some 30 years…what did he tell you about groupers?what did he tell you about long-spined sea urchin numbers? What did you NOT see in this video that you should have seen if over-fishing were a problem? Are there other explanations for lack of herbivores? Are there other explanations for algal overgrowth? Are we fertilizing the algae? What else is in the fertilizer? The very contagious white pox coral disease is caused by Serratia marcescens found in human feces. Is the problem on San Salvador really overfishing or something more complex?
Trophic Pyramid 3° Consumer - Carnivore feeding on Carnivores 2° Consumer Carnivore Numbers Biomass Energy 1° Consumer Herbivore Producer Photosynthesis from?
Trophic Funnel! Energy Biomass Numbers Producer Photosynthesis 1° Consumer Herbivore 2nd Law of Thermodynamics 2° Consumer Carnivore So this is a leaky funnel! 3° Consumer - Carnivore feeding on Carnivores
Photosynthesis Light Energy CO2 + H2O O2 + CH2O chlorophyll carbon dioxide + water oxygen + carbohydrate Food for Consumers! Primary Producers: Plants, Algae, Cyanobacteria
Trophic Calendar! Colonize and Establish Large Population Food Supply for Ecosystem Habitats for Others Time Producer Photosynthesis Population of Generalists 1° Consumer Herbivore Small Pop 2° Consumer Carnivore 3° Consumer - Carnivore feeding on Carnivores
Liberally adapted from: David W. Goldsmith. 2003. The great clade race: presenting cladistic thinking to biology majors and general science students. The American Biology Teacher 65: 679-682. Runners can finish anywhere along this northern edge The Forest Meet • This game is a cross-country meet in a forest • All runners enter the forest by a single south entrance • The finish line is the northern boundary of the forest • Runners need not exit at any particular place at the finish • There are many trails through the woods • Trails only bifurcate (form two branches) at forks • Trails never join together or rejoin after forking • Along the trail straightaways are check-in stations • At each check-in station, an official has a unique stamp • Each runner has a card that is stamped as s/he passes a station • Runners are not allowed to retrace a path • All runners must finish the race Start
Bob Sue ♠ Jen♥ Deb Lou♥ Cal Hal Val♣♠ 11. Using these stamp cards handed in at the finish line: • Sketch the trail map • Show all station locations (on the straightaways) • Mark the exit used by each runner
Runners can finish anywhere along this northern edge The Forest Meet Sharing our Results Since all the cards have the circle stamp, it must have been issued at a station in the first part of the trail system, so that each runner would pass it. Start
The Forest Meet Sharing our Results
The Forest Meet Sharing our Results
The Forest Meet Sharing our Results
Runners can finish anywhere along this northern edge The Forest Meet Five of the runners passed the teardrop station, but three did not, so our 8 runners must have divided into two groups Sharing our Results Bob, Deb, Cal Sue, Lou, Jen, Hal, Val Start
The Forest Meet Sharing our Results
Hal Runners can finish anywhere along this northern edge The Forest Meet Because paths do not rejoin, Hal is separated and thus we can draw him at the finish line Four runners of the group of five passed the diamond station, but Hal did not, so he split away before this station Sharing our Results Sue, Lou, Jen, Val Bob, Deb, Cal Sue, Lou, Jen, Hal, Val Start
Bob Cal Deb Hal Jen Lou Sue Val The Forest Meet Notice the runners are in alphabetical order. But this is not the only solution All branches can be rotated: e.g.: Lou before Jen Sue-Val before Jen-Lou Start
Translating the Forest Meet to Evolution on an Island The forest represents the time-space continuum on the island Time is shown by the runners moving from south to north The entrance represents an arrival of a pioneer colonizer on-island The north finish line represents the present time The names at the finish line represent extant organisms on-island The meet cards represent the phenotypes of extant organisms The stamp marks are the genotype changes leading to phenotype The branching trails show adaptive radiation (speciation) pathways The shared marks are the synapomorphies (shared derived traits) you used to determine the evolutionary pathways You carried out a cladistic analysis… intuitively with very little help from me. Congratulations!
How do you DO cladistics? • Look at a group of organisms that you think are related • Find a not-too-distantly related (primitive?) out-group • Select characters that will help to distinguish the organisms • Polarize the character states by: • Stratigraphic sequence (fossil sequence) • Developmental sequence (ontogeny recaps phylogeny) • Outgroup comparison • Build a data matrix • Group by number of synapomorphies (shared derived) • Sketch possible cladograms • Seek simplest (most parsimonious) cladogram
OG E B A C D Asian Oahu Kauai Hawaii Maui Kauai E B A D C -- 2 Large Black Wide Wide Dark Wide Long Long Thick Long 0 0 0 0 0 0 0 0 0 0 0 0 1 1 0 1 0 0 1 1 1 0 0 0 0 1 1 0 0 1 0 1 0 1 1 1 0 1 1 1 0 0 0 1 1 1 0 1 1 1 1 0 0 0 0 1 0 0 0 1 2 1 1 3 2 5 1 2 3 5 -- 3 -- 7 -- 8 -- 5 -- 1 OG -- 9 -- 4 -- 10 -- 6
Asia Kauai Oahu Maui Hawaii OG E B A D C -- 2 black eye -- 7 long wing -- 3 wide neck -- 8 long leg -- 5 dark body -- 1 large eye -- 9 thick leg -- 4 wide body -- 6 wide wing -- 10 long stinger