Download
1 / 22
220 likes | 473 Views
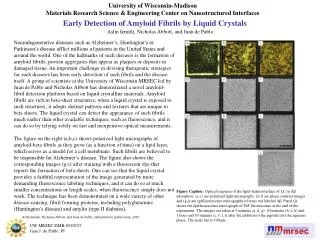
Use of Dynamic Light Scattering to Detect the Growth of Amyloid Fibrils in HEWL. . What are they? Why should we study them?. Proteins bonded in a very specific manner How they are formed is not understood Associated with many diseases, including: Alzheimer’s Disease Mad Cow Disease.

E N D
Use of Dynamic Light Scattering to Detect the Growth of Amyloid Fibrils in HEWL.
What are they? Why should we study them? • Proteins bonded in a very specific manner • How they are formed is not understood • Associated with many diseases, including: • Alzheimer’s Disease • Mad Cow Disease
Hen Egg White Lysozyme • In water, HEWL is in folded state • Hydrogen bonding • TFE partially unfolds, then stabilizes HEWL • Newly exposed portions of HEWL should bond to each other, forming strands
How Could We Study Them? • We wanted to characterize their rate of formation • Disturbing the proteins would make any data collected questionable • How could we solve this problem?
What is DLS? • Detects the changing interference pattern of laser light scattered by small particles in solution. • From the rate of change, we can measure the diffusion rate and size of the particles.
What is the Autocorrelation Function? • Put simply: the average of the time varying portion of the intensity at some initial time, t, with the time varying portion of the intensity at some later time, t+∆t.
OK, It isn’t really that simple… • This calculation is done for many values of ∆t. • It is repeated many times (in our case, ~400), each time averaging the new result with the average of all the previous results.
Why would you do that? • For small values of ∆t, the signal is still correlated with the signal at t = 0; positive average intensity. • For large values of ∆t, this is not true, and the autocorrelation function will eventually average out to zero.
Key Point • By measuring how long it takes the function to go to zero, we can tell how fast the particles are moving!
In Conclusion • Succeeded in producing a DLS setup • Induced aggregation in HEWL with TFE • Unable to prove that aggregate contained Amyloid Fibrils • With more time, experiment could be completed
Special Thanks Dr. Stephen Hagen Dr. Robert DeSerio Caleb Carswell University of Florida Physics Department