Download
1 / 6
60 likes | 323 Views
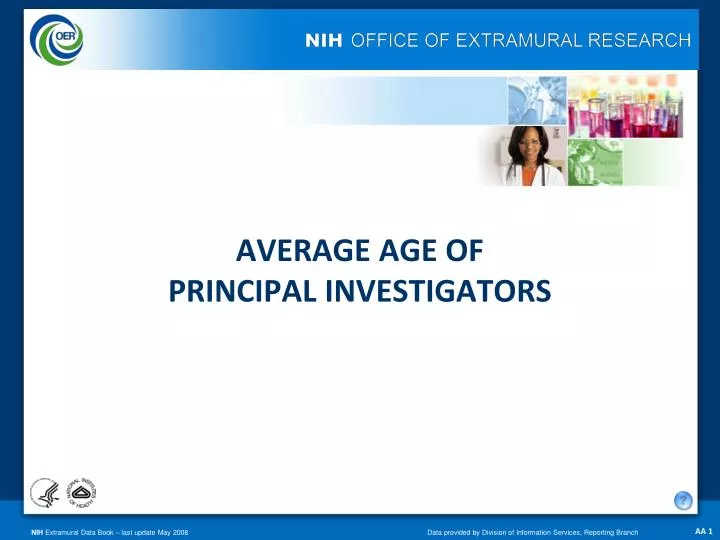
AVERAGE AGE OF PRINCIPAL INVESTIGATORS. TABLE OF CONTENTS. AVERAGE AGE OF R01-EQUIVALENT PRINCIPAL INVESTIGATORS. All Investigators. First-Time Investigators. Average Age. Fiscal Year. AGE DISTRIBUTION OF R01-EQUIVALENT PRINCIPAL INVESTIGATORS, FY 2007. All Investigators.

E N D
AVERAGE AGE OF R01-EQUIVALENT PRINCIPAL INVESTIGATORS All Investigators First-Time Investigators Average Age Fiscal Year
AGE DISTRIBUTION OF R01-EQUIVALENT PRINCIPAL INVESTIGATORS, FY 2007 All Investigators First-Time Investigators Average Age All Investigators 51.0 First-Time Investigators 42.6 Percent of Total Age
AVERAGE AGE OF FIRST-TIME R01-EQUIVALENT PRINCIPAL INVESTIGATORS BY DEGREE Average Age Fiscal Year
DEFINITIONS AND ADDITIONAL INFORMATION To access data tables for each slide while in presentation view right-click on the slide and select “edit slides” Then double-click on the graph image and the datasheet should appear in a separate window or select the data tab from the spreadsheet. If the datasheet does not appear, right-click in the chart area and select “datasheet”