Download
1 / 22
370 likes | 1.09k Views
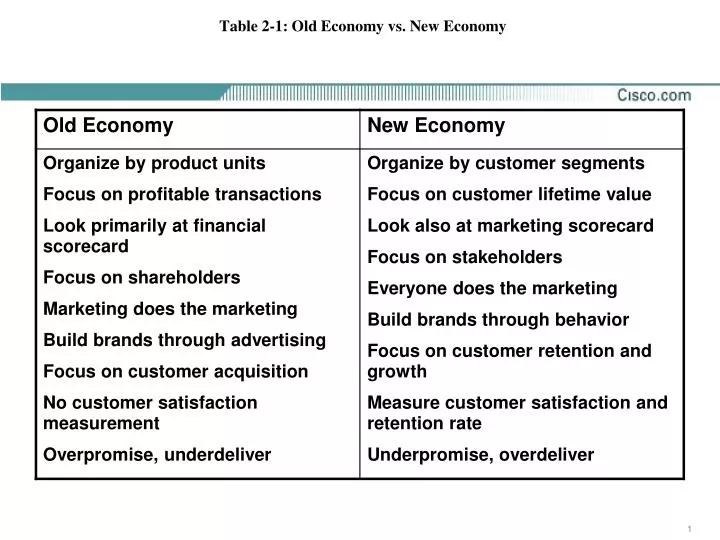
Table 2-1: Old Economy vs. New Economy. Measuring (and Acting upon) Customer Satisfaction . Description of Cisco processes for Data Gathering Driving Action from the Data. Data. Tell the Customer !. Goals. Analysis. Progress Metrics. Drivers. Initiatives. Truly Loyal. Accessible.

E N D
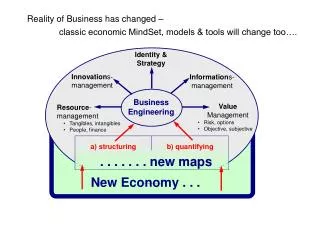
Description of Cisco processes for Data Gathering • Driving Action from the Data Data Tell the Customer ! Goals Analysis Progress Metrics Drivers Initiatives
Truly Loyal Accessible Trapped High Risk Satisfaction Motivation Reward for Performance Increasing Company Value Cisco Strong emphasis on customer satisfaction Revenue Loyalty Stock ownership Cisco Bonus Program Time Customer Satisfaction and Loyalty
The Complete Measurement Process Relationship Survey “Annual Sat Survey” Broad representation of all End-Users Partner served customers All theaters, all people 15 to 20 minutes Length Indications / Directions Overall Satisfaction Loyalty factors Experience satisfaction : Pre-Sales Team, Post-Sales Software, Products indicate Digging / More Info Follow-on surveys EMBU Product Surveys Focus groups / TAGs Product Beta tests Understanding Selected Customers Particular subjects Could be deep & long understand measure Ongoing Tracking TAC Bingo Cust. Service survey CCO Satisfaction Internal Measures : On time shipment Bugs per week Transaction Every User Every time Small & Quick We need all three layers to Measure and Improve Customer Satisfaction
ContinuousFlow – Annual Satisfaction Measurement Replies = Data Sources “One-byOne” Field Sales Anyone at Cisco Channel Partners : www.cisco.com/go/pal/ “Mass Upload” TAC case customers Web users Networkers attendees Etc. Invite Analysis / Actions Start 1 August Stop 15 July Bonus Calculations 30 Apr Invitations / Replies Thru-Out the Year = It’s a Continuous Process A Particular Person gets ONE survey during the year = It’s an Annual“event”
Real Time Invitations: Cisco and Partners Cisco: Web Based Names Tool Cisco Partners: External Portal And Web Based Names Tool SEARCH company Name database SEND Options
Customer Information Gathered • Sample Information Includes • Name, e-mail, Country • Account Manager and System Engineer • Sales Hierarchy ( Theater, Area, Operation, Region ) • Partner Name sending invitation • Cisco Standard Company (CSC) name • Global Ultimate ID - GUID • Company Target ID - CoTgtID • Company site ID ( future ) • Customer Input • Co. Size, Market Type, Role in Company • Cisco Products in Use • Follow-up Contact Y/N ? & Release Info to Partners Y/N ? • Name, phone, address for further contact
Names Machine- Real Time Status Names Blanked Out
Annual Survey Questionnaire :http://survey.walkerinfo.com/MZTEST0
TAC “Bingo” Customer Survey BINGO survey for every Closed TAC case
Reporting Tools Allow Wide Access to Results Scoreboards Fixed Format Reports GUID and CoTgtID codes allow Company Specific Reporting too
36% 47% 3% 2% Truly Loyal Truly Loyal Accessible Accessible Trapped Trapped High Risk High Risk 32% 29% 29% 21% We Compare Cisco to Others via BenchmarksSource : “Analysis of Cisco Customer Loyalty – Walker Information Oct, 2002 IT Benchmark Network Sector (Excl. Cisco) 2002 National IT Customer Benchmark Study - Cisco IT Benchmark Total (Incl. Cisco) GUID and CoTgtID codes allow Company Specific Loyalty
OK - We Have a Bunch of Data . . . So What ? What are the Key Drivers of Satisfaction and Loyalty ? • “This finding supports previous analyses that have shown that for customers worldwide (regardless of loyalty level), satisfaction towards Cisco is largely driven by how they perceive interactions with the Account Team, HardwareProducts and Post-Sales Technical support” - (Walker National Benchmark study) • “Three separate analysis techniques were employed to rigorously test which key areas influence whether a customer is Trapped or Truly Loyal. All three analyses confirmed the same key areas:” • Hardware Products • Account Team • Post-Sales Technical Support - (Analysis of FY-02 Cisco data) Source : “Analysis of Cisco Customer Loyalty – Walker Information Oct, 2002
Taking Action to Improve Support Satisfaction • WalkerInfo Computes relative Impact, or Importance - Timely Case Closure is seen to be the Biggest Driver of Post Sales support • Lower Sat level too, so there is plenty of “Runway” around this issue. • CA Initiatives for FY-03: • TRIP – Timely Resolution Improvement • Re-Launch of TAC-WEB site • PSI – Product Serviceability Improvement • Low Score Follow-Up Process
Post Sales Support ( cisco ) Real Time, Web based Reporting Customer Advocacy takes Goal on overall Support Q# 34 The TAC team watches this Number While BINGO Q #3 is the Business metric
Communicating in Cisco “My Customer” Pages Note: Demo Data Low Score Alerts Consolidating Customer Sat information as well as Service and Sales Initiatives For Top 3,000 accounts Satisfaction, Loyalty by Customer Company Specific Scores and Alerts
Communication to CustomersSurvey Participants See this Link in the Thank-you note http://www.cisco.com/warp/public/750/cust_sat/strength_areas.html
The Action Process Customer Follow-up Phone Interviews. . . Low scores - Contact Annual Survey : Indications Goals Transactional : Timely Data Running Metrics Trends Comments : Extra Information • “Overall” surveys gives Directions and Goals- ANNUAL • Initiatives Delivered by Business Owners • Transactional measures for tracking – eg: TACBINGO
22 22 22