Download
1 / 50
500 likes | 637 Views
Genome-wide computational prediction of transcriptional regulatory modules reveal new insights into human gene expression Mathieu Blanchette et al. Presented By: Manish Agrawal. Outline. Introduction Cis regulatory module (CRM) prediction algorithm In silico validation of predicted modules

E N D
Genome-wide computational prediction of transcriptional regulatory modules reveal new insights into human gene expression Mathieu Blanchette et al. Presented By: Manish Agrawal
Outline • Introduction • Cis regulatory module (CRM) prediction algorithm • In silico validation of predicted modules • Experimental validation of predicted modules • Location of CRMs relative to genes • Conclusions
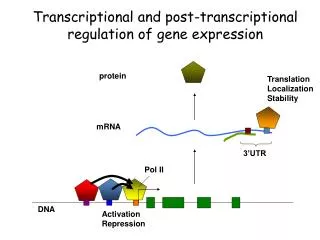
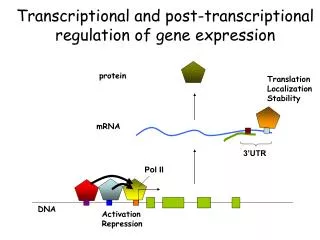
Gene Regulation • Chromosomal activation/deactivation • Transcriptional regulation • Splicing regulation • mRNA degradation • mRNA transport regulation • Control of translation initiation • Post-translational modification Source: Lecture Notes by Prof. Saurabh Sinha, UIUC
GENE ACAGTGA PROTEIN Transcriptional regulation TRANSCRIPTION FACTOR Source: Lecture Notes by Prof. Saurabh Sinha, UIUC
GENE ACAGTGA PROTEIN Transcriptional regulation TRANSCRIPTION FACTOR Source: Lecture Notes by Prof. Saurabh Sinha, UIUC
Transcription Factors(TFs) • They generally have affinity for short, degenerate DNA sequences (5-15 bp). • Experiments have enabled identification of consensus-binding motifs for hundreds of TFs. • The binding motifs are generally represented by position-weight matrices (PWM).
Binding site sequence alignment Source: http://trantor.bioc.columbia.edu/Target_Explorer/manual/matrix.html
Alignment matrix for a binding site Source: http://trantor.bioc.columbia.edu/Target_Explorer/manual/matrix.html
Position weighted matrice (PWM) Source: http://trantor.bioc.columbia.edu/Target_Explorer/manual/matrix.html
Position weighted matrice (PWM) • To transform elements of the alignment matrix to the weight matrix we used the following formula: • weighti,j = ln (ni,j+pi)/(N+1) ~ ln (fi.j /pi) pi • N - total number of sequences (15 in this example) • ni,j - number of times nucleotide i was observed in position j of the alignment. • fi,j = ni,j/N - frequency of letter i at position j • pi - a priori probability of letter I • In this example pT,A is equal to 0.3 and pC,G is equal to 0.2 (overall frequency of the letters within Drosophila melanogaster genome) Source: http://trantor.bioc.columbia.edu/Target_Explorer/manual/matrix.html
Position weighted matrice (PWM) • Weight matrix can be used to evaluate the resemblance of any L bp DNA sequence to the training set of binding sites. • The score for this sequence is calculated as the sum of the values that each base of the sequence has in the weight matrix. • Any sequence with score that is higher then the predefined cut-off is a potential new binding site. Source: http://trantor.bioc.columbia.edu/Target_Explorer/manual/matrix.html
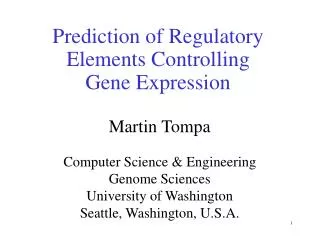
Complications in indentification of TF-binding sites (TFBSs) • The binding of a TF also depends on other factors like the chromatin environment and the cooperation or competition with other DNA binding proteins. • In higher eukaryotes, TFs rarely operate by themselves, but a combination of TFs act together to achieve the desired gene expression. The DNA footprint of this set of factors is called cis-regulatory module (CRM).
Features of CRMs • CRMs generally consist of several binding sites for a TF. • CRMs, and in particular the binding sites they contain, are generally more evolutionarily conserved than their flanking intergenic regions • Genes regulated by a common set of TFs tend to be co-expressed.
Outline • Introduction • CRM prediction algorithm • In silico validation of predicted modules • Experimental validation of predicated modules • Location of CRMs relative to genes • Conclusions
Predicting CRMs • Different combinations of these features (of CRMs) have been used, often with PWM information, to predict regulatory elements for specific TFs. • However, very few existing methods are designed to be applied on a genome-wide scale without prior knowledge about sets of interacting TFs or sets of co-regulated genes. • Previous works had generally taken 5-10 PWMs and they looked for the clusters of these PWMs in the genome. Such studies have been reported for embryo development in Drosophila.
Goals and challenges • The goal of this study is to do a genome-wide analysis and identify CRMs in human genome without any prior knowledge about interaction of TFs. • The new algorithm only uses the features of CRMs (mentioned earlier) for its prediction. • Although, CRMs predicted like this may contain a significant number of false positives, the whole genome approach provides sufficient statistical power to formulate specific biological hypotheses.
CRM prediction algorithm (Overview) Mathieu Blanchette et al. Genome Res. 2006; 16: 656-668
CRM prediction algorithm • A set of 481 vertebrate PWMs frm Transfac 7.2 was used for the analysis. PWMs were grouped into 229 families. • The genome-wide multiple alignment was done for the human, mouse and rat genomes by the MULTIZ program. Only the regions within MULTIZ alignment were considered in the later part of the study. These regions cover 34% of the human genome • For each of the 481 PWMs, individual binding sites were first predicted. The human, mouse and rat genomes were scanned separately on both strands, and a log likelihood score is computed in the standard way.
CRM prediction algorithm • For each species and each PWM, a hit score was computed. Later, a weighted average of the human, mouse and rat scores was used to define a “hit score” for each alignment column p and PWM m, • hitScorealn(m,p)= hitScoreHum(m,p) + 1/2 max(0, hitScoreMou(m,p) + hitScoreRat(m,p)) • The human hit scores has been given higher weight to allow prediction of human-specific binding sites, provided that they are very good matches to the PWM considered. • Only positions with hitScorealn(m,p)> 10 are retained to construct modules. This threshold is somewhat arbitrary but results in total number of bases predicted in pCRMs to be ~2.88% of the genome.
CRM prediction algorithm: Computation of module score • We need moduleScore(p1…p2) for the alignmentregion going from position p1 to p2 of human. • DefineTotalScore(m, p1.p2) to be the sum of the hitScoresaln of allnon-overlapping hits for m in the region p1.p2. • The optimization problem of choosing the best set of non-overlapping hits is solved heuristically using a greedy algorithm. This greedy algorithm iteratively selects the hit with the maximal score that does not overlap with the other hits previously chosen. • For each matrix and each region, a P-value is assigned.
CRM prediction algorithm: Computaion of module score • The score for a module is computed based on one to five PWMs called tags. • The first tag for region p1.p2 is thematrix with the most significant TotalScore, i.e., tag1 = argminm PWMspValue(TotalScore(m,p1.p2)). • The regions belonging to tag1 are then masked out and the TotalScores for each matrix are recomputed, excluding hits overlapping those of tag1. • Thesecond tagis then the matrix with most significant TotalScore. The process is repeated until five tags are selected if possible.
CRM prediction algorithm: Computation of module score • Finally, we define totalModuleScore as a function of the P-values of individual tags. • So, a module can consist of one to five tags, depending on which number of tags yields the highest statistical significance. • The above algorithm was used to search for modules of maximal length 100, 200, 500, 1000 and 2000 bp.
CRM prediction algorithm (Overview) Mathieu Blanchette et al. Genome Res. 2006; 16: 656-668
Results • The algorithm could identify about 118,000 putative CRMs covering 2.88% of the genome. • This constitutes one of the first genome-wide, non-promoter centric set of human cis-regulatory modules. • The biological relevance of pCRMs were evaluated by measuring the extent they overlap known regulatory elements in databases such as TRRD, Transfac and GALA.
Outline • Introduction • CRM prediction algorithm • In silico validation of predicted modules • Experimental validation of predicated modules • Location of CRMs relative to genes • Conclusions
In silico validation of predicted modules Mathieu Blanchette et al. Genome Res. 2006; 16: 656-668
Comparison to other genome-wide predictions • The ability of the algorithm to take advantage of interspecies TFBS conservation contributes in good part to its accuracy. • The 34% of the human genome that lies within an alignment block with the mouse and rat genome contains 90% of bases within Transfac sites, 67% of those within TRRD modules, and 87% of those within GALA regulatory regions.
Outline • Introduction • CRM prediction algorithm • In silico validation of predicted modules • Experimental validation of predicted modules • Location of CRMs relative to genes • Conclusions
Experimental validation of predicted modules • Experimentally verified the data by Chip-chip analysis. • This method allows for the large scale identification of protein-DNA interactions as they occur in vivo.
Chip-chip Analysis Buck et al. Genome Biol. 2005; 6(11): R97
Experimental validation of predicted modules • They selected modules predicted to be bound by the estrogen receptor (ER), the E2F transcription factor (E2F4), STAT3 and HIFI to print a DNA microarray. • The microarray contains 758, 1370, 860 and 1882 modules predicted to be bound by ER, E2F4, STAT3, and HIFI respectively. • In the current study, the microarray was then probed by ChIP-chip for ER and E2F4, respectively. • Approx. 3% of the 758 ER-predicted pCRMs on the microarray actually proved to be bound by ER, while 17% of the 1370 E2F4-predicted pCRMs on the microarray were bound by E2F4.
Experimental validation of predicted modules • These numbers need to be considered as an underestimation of the actual specificity of the algorithm, since the protein-DNA interactions were tested in a single cell type, while TFs are known to regulate different sets of genes in different cell types, physiological conditions, and time in development. • In addition, the experiment was conducted under a single set of conditions (concentration of estradiol, time of treatment, etc. ). For all of these reasons, it is difficult to determine the real accuracy of the algorithm.
Experimental validation of predicted modules • As the microarray contained, predicted modules for four different TFs, the data can be used to assess the specificity of TFBS predictions. • Among the 55 modules bound by ER, 44% were indeed selected for their ER-binding sites and among the 433 modules bound by E2F4, 54% were selected for that factor. • In addition to false positive ChIP-chip signals or the failure of the algorithm to detect some binding sites, it is likely that binding of TFs through alternative mechanisms such as protein-protein interactions contributes to this result. • The present algorithm can only predict the binding of TF through direct DNA-binding interactions.
Outline • Introduction • CRM prediction algorithm • In silico validation of predicted modules • Experimental validation of predicated modules • Location of CRMs relative to genes • Conclusions
Distribution of pCRMs along a region of chromosome 11 Mathieu Blanchette et al. Genome Res. 2006; 16: 656-668
Global view of the gene regulatory landscape • The moduledensity varies widely across the genome, with an average offour modules per 100 kb and a maximum of 44 modules per 100-kbwindow, covering from 0% to 55% of such a region. • As illustrated in the previous figure, some regions are rich in modules,but relatively poor in genes. In some cases, this could reflectthe presence of many unknown protein-coding genes, or at leastof many alternative TSSs. Another possible explanation is thatsome of these modules may be regulating the transcription ofnoncoding transcripts. • Finally, this observation may be due to the presence of long-range enhancers, which may affect transcription of genes upto several hundreds of kilobases away.
Regulatory modules are preferentially located in specific regions relative to genes • The position of pCRMs with respect to their closest gene was studied. • The genome was divided into several types of noncodingregions, i.e., upstream of a gene, 5' UTR, 1st intron, internalintrons, last intron, 3' UTR, and downstream region. • Withineach type of region, they computed the fraction of bases includedin a pCRM as a function of the distance to a reference pointfor each type of region.
Distribution of pCRMs relative to specific regions of the genes Mathieu Blanchette et al. Genome Res. 2006; 16: 656-668
Observations • Regions immediately surrounding TSSs are highly enriched for predicted modules. This was expected as this region often contains the promoter of the genes. Surprisingly, there are modules immediately downstream of TSSs. These may represent alternative promoters for initiation downstream from the annotated transcripts. • Regions surrounding the sites of termination are also enriched for modules. 3' UTRs are essentiallyas enriched as 5' UTRsfor pCRMs. Two reasons may explain this. First,these may represent enhancer type of regulatoryelements thatactivate the upstream gene via a DNA-looping mechanism.Second,these may represent promoter elements driving noncodingtranscript,antisense relative to the coding gene. Such antisensetranscriptsmay regulate gene expression by a post-transcriptionalmechanism
Distribution of pCRMs relative to specific regions of the genes Mathieu Blanchette et al. Genome Res. 2006; 16: 656-668
Observations • Another surprising observationis that the density of modulesis the lowest in regions located10–50 kb upstream ofthe TSS and, symmetrically, 10–30kb downstream of theend of transcription. This is unexpected,as one would expectthat these regions (at least those upstreamof the TSS) wouldbe prime estate for transcriptional regulation. • However, thisis confirmed by the density of interspecies conservedelements,which is also at its lowest in those regions. • Being closeto the TSS, regulatory elements in these regions maybe allowedto contain fewer binding sites (or binding siteswith less affinity),making them difficult to detect using the currentmethod.
Observations • Alternatively,these regions(10-50 kb upstream) may actually be depletedfor regulatory elements.This could be due to constraints imposedby the chromatin structureof the nuclear architecture, makingit more difficult for theDNA of these regions to come in physicalproximity to the TSS. • Another notable observation is that the density of predicted modules in intronic regions is very low in the close vicinity of exons (except the first and the last one), but increases with the distance to the closest exon.
TFs target different regions relative to their target genes. RED => Highly enriched for TFBSs, BLUE => Depleted in TFBSs Mathieu Blanchette et al. Genome Res. 2006; 16: 656-668
TFs target different regions relative to their target genes. • The previous figure shows that more than 70 of the 229 TFs families considered exhibit a significant enrichment for one or more types of genomic regions. • A number of TFs show preference for distal positions, mostly those located more than 100 kb upstream of the TSS, and are also enriched within introns. This set of TFs is enriched for factors containing homeo domains or basic helix-loop-helix domains and are often involved in regulating development.
TFs target different regions relative to their target genes. • A second set of TFs preferentially binds within 1 kb of the TSSs. This set is enriched for leucine zipper TF and factors from Ets family. Notably, most of these factors, contrary to what is observed for those binding distal sites, are involved in basic cellular functions.
Outline • Introduction • CRM prediction algorithm • In silico validation of predicted modules • Experimental validation of predicated modules • Location of CRMs relative to genes • Conclusions
Conclusions • Blanchett et al have identified a setof rules describing the architecture of DNA regulatory elementsand used them to build an algorithm allowing them to explore theregulatory potential of the human genome. • Although the false positive rate in CRM prediction is likely to be high, the statistical power obtained through a large-scale, genome-wide approach revealed new insights about transcriptional regulation. • It was noted that a significant number of TFs have a strongbias for regulating genes either from a great distance or frompromoter-proximal binding sites.
Conclusions • Noteworthy is the fact thatmost TFs that preferentially work from a large distance areinvolved in development, while those predicted to work frompromoter-proximal sites tend to regulate genes involved in basiccellular processes. • It is expected that the database containing the modules presented in this study may speed up the discovery and experimental validation of CRMs