Download
1 / 56
560 likes | 562 Views
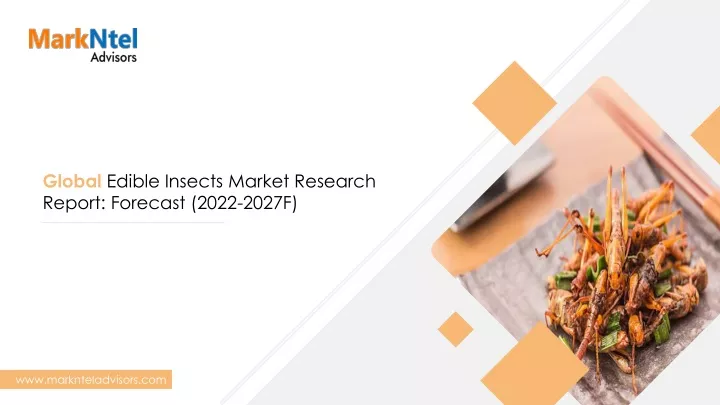
According to MarkNtel Advisors research report, the Global Edible Insects Market is expected to witness a significant growth rate during the forecast period, i.e., 2022-27.

E N D
Global Edible Insects Market Research Report: Forecast (2022-2027F) www.marknteladvisors.com © 2022 | Reproduction is forbidden | All rights reserved
Document Outline 02 Research Scope Report Particulars, Key Questions Answered, Market Segmentation, Table of Content Sample Illustration Global Edible Insects Market Research Report: Forecast (2022-2027F) 13 Research Process & Methodology Research Approach, Research Methodology 22 29 Commercials About MarkNtel Advisors Who we are? 31 33 Disclaimer & Contact Details 2 © 2022 | Reproduction is forbidden | All rights reserved
Report Particulars Research Scope Timeline 2017 2021 2022 2027 Base Year Forecast Year Historical Year Estimated Year Note: Base year used for company profiles is 2021 and 2020 in case where information was not available Market Measurements Value in USD Million • Report Published January, 2022 • Number of Pages in the Report 200+ • Key Research Variables Macroeconomic indicators’ growth at present levels are assumed to persist during the forecast period as well The allied industry qualitative and quantitative insights along with the end user adoption pattern have been considered in market engineering Charts in the figure represent the calendar year. The charts in the sample are not meant to be scaled Major sources of information include company annual reports, government sources, articles, industry association publications, trade websites, expert opinions, technical handbooks, research studies, and company press releases Revenues estimated are according to the feedback collected through primary interviews and data from secondary sources • • Assumptions & Considerations • • • 3 © 2022 | Reproduction is forbidden | All rights reserved
Key Questions Answered in the Report What is the market size along with the current and future trends of the Global Edible Insects Market? How the industry has been evolving in each region, and which segments would dominate the market during the forecast period? What are the key opportunity areas that companies foresee in the next five years (2022-27)? Who are the key players in the market, and What are their competitive strengths? What are the key growth drivers and challenges associated with the market and how would they impact the market through the forecast period? 4 © 2022 | Reproduction is forbidden | All rights reserved
Market Segmentation Global Edible Insects Market By Insect Type • Crickets • Mealworms • Black Soldier Flies • Buffalo’s • Grasshoppers • Ants • Silkworms • Cicadas • Beetles • Caterpillar • Others By Product Type • Insect Powder • Protein Bars • Whole Insects • Entomo Farms • HaochengMealworm Inc. • HargolFoodTech • Ÿnsect SAS • Others By Region • North America • The US • Canada • Mexico • South America • Brazil • Rest of South America • Europe • Germany • The UK • France • The Netherlands • Italy • Spain • Russia By Company • AgriProteinTechnologies • Aspire Food Group • All Things Bugs • Beta Hatch • Bioflytech • DeliBugs Ltd. • Eat Grub Ltd. • Thailand Unique • Nordic Insect Economy • KrecaEnto - Food BV • Entomo Farms Ltd. • ProtifarmNV • EnviroFlightLLC • EntoCube, Ltd. • Poland • Rest of Europe • Middle East & Africa • Saudi Arabia • Egypt • South Africa • Rest of Middle East & Africa • Asia Pacific • China • Japan • South Korea • Thailand • Vietnam • Rest of Asia Pacific By End User • Human Consumption • Animal Feed • Agriculture 5 © 2022 | Reproduction is forbidden | All rights reserved
Study Background – Project Outline (1/8) Table of Content 1. Introduction 1.1. Product Definition 1.2. Research Process 1.3. Market Segmentation 1.4. Assumptions 2. Preface 3. Executive Summary 4. Impact of Covid-19 on Global Edible Insects Market 5. Global Edible Insects Market Trends & Insights 6. Global Edible Insects Market Dynamics 6.1. Drivers 6.2. Challenges 7. Global Edible Insects Market Regulations & Policies 8. Global Edible Insects Market Supply Chain Analysis 9. Global Edible Insects Market Hotspots & Opportunities 10. Global Edible Insects Market Outlook, 2017-2027F 10.1.Market Size & Analysis 10.1.1. By Revenues (USD Million) 6 © 2022 | Reproduction is forbidden | All rights reserved
Study Background – Project Outline (2/8) Table of Content 10.2. Market Share & Analysis 10.2.1. By Insect Type 10.2.1.1. Crickets 10.2.1.2. Mealworms 10.2.1.3. Black Soldier Flies 10.2.1.4. Buffalo’s 10.2.1.5. Grasshoppers 10.2.1.6. Ants 10.2.1.7. Silkworms 10.2.1.8. Cicadas 10.2.1.9. Beetles 10.2.1.10. Caterpillar 10.2.1.11. Others 10.2.2. By Product Type 10.2.2.1. Insect Powder 10.2.2.2. Protein Bars 10.2.2.3. Whole Insects 10.2.3. By End-User 7 © 2022 | Reproduction is forbidden | All rights reserved
Study Background – Project Outline (3/8) Table of Content 10.2.3.1. Human Consumption 10.2.3.2. Animal Feed 10.2.3.3. Agriculture 10.2.4. By Region 10.2.4.1. North America 10.2.4.2. South America 10.2.4.3. Europe 10.2.4.4. Middle East & Africa 10.2.4.5. Asia-Pacific 10.2.5. By Company 10.2.5.1. Competition Characteristics 10.2.5.2. Market Share of Leading Companies, By Revenues 11. North America Edible Insects Market Outlook, 2017-2027F 11.1.Market Size & Analysis 11.1.1. By Revenues (USD Billion) 11.2.Market Share & Analysis 11.2.1. By Insect Type 11.2.2. By Product Type 8 © 2022 | Reproduction is forbidden | All rights reserved
Study Background – Project Outline (4/8) Table of Content 11.2.3. By End User 11.2.4. By Country 11.2.4.1. The US 11.2.4.2. Canada 11.2.4.3. Mexico 12. South America Edible Insects Market Outlook, 2017-2027F 12.1.Market Size & Analysis 12.1.1. By Revenues (USD Billion) 12.2.Market Share & Analysis 12.2.1. By Insect Type 12.2.2. By Product Type 12.2.3. By End User 12.2.4. By Country 12.2.4.1. Brazil 12.2.4.2. Rest of South America 13. Europe Edible Insects Market Outlook, 2017-2027F 13.1.Market Size & Analysis 13.1.1. By Revenues (USD Billion) 9 © 2022 | Reproduction is forbidden | All rights reserved
Study Background – Project Outline (5/8) Table of Content 13.2.Market Share & Analysis 13.2.1. By Insect Type 13.2.2. By Product Type 13.2.3. By End User 13.2.4. By Country 13.2.4.1. Germany 13.2.4.2. The UK 13.2.4.3. France 13.2.4.4. The Netherlands 13.2.4.5. Italy 13.2.4.6. Spain 13.2.4.7. Russia 13.2.4.8. Poland 13.2.4.9. Rest of Europe 14. The Middle East & Africa Edible Insects Market Outlook, 2017-2027F 14.1.Market Size & Analysis 14.1.1. By Revenues (USD Billion) 14.2.Market Share & Analysis 10 © 2022 | Reproduction is forbidden | All rights reserved
Study Background – Project Outline (6/8) Table of Content 14.2.1. By Insect Type 14.2.2. By Product Type 14.2.3. By End User 14.2.4. By Country 14.2.4.1. Saudi Arabia 14.2.4.2. Egypt 14.2.4.3. South Africa 14.2.4.4. Rest of Middle East & Africa 15. Asia-Pacific Edible Insects Market Outlook, 2017-2027F 15.1.Market Size & Analysis 15.1.1. By Revenues (USD Billion) 15.2.Market Share & Analysis 15.2.1. By Insect Type 15.2.2. By Product Type 15.2.3. By End User 15.2.4. By Country 15.2.4.1. China 15.2.4.2. Japan 11 © 2022 | Reproduction is forbidden | All rights reserved
Study Background – Project Outline (7/8) Table of Content 15.2.4.3. South Korea 15.2.4.4. Thailand 15.2.4.5. Vietnam 15.2.4.6. Rest of Asia Pacific 16. Global Edible Insects Market Key Strategic Imperatives for Growth & Success 17. Competition Outlook 17.1.Competition Matrix 17.1.1. Brand Specialization 17.1.2. Target Markets 17.1.3. Target End Users 17.1.4. Research & Development 17.1.5. Strategic Alliances 17.1.6. Strategic Initiatives 17.2.Company Profiles 17.2.1. AgriProtein Technologies 17.2.2. Aspire Food Group 17.2.3. All Things Bugs 17.2.4. Beta Hatch 12 © 2022 | Reproduction is forbidden | All rights reserved
Study Background – Project Outline (8/8) Table of Content 17.2.5. Bioflytech 17.2.6. DeliBugs Ltd. 17.2.7. Eat Grub Ltd. 17.2.8. Thailand Unique 17.2.9. Nordic Insect Economy Ltd. 17.2.10. KrecaEnto - Food BV 17.2.11. Entomo Farms Ltd. 17.2.12. ProtifarmNV 17.2.13. EnviroFlightLLC 17.2.14. EntoCube, Ltd. 17.2.15. Entomo Farms 17.2.16. HaochengMealworm Inc. 17.2.17. HargolFoodTech 17.2.18. Ÿnsect SAS 17.2.19. Others 18. Disclaimer 13 © 2022 | Reproduction is forbidden | All rights reserved
List of Figures (1/3) List of Figures Figure 1: Global Edible Insects Market Revenues (USD Million), 2017-2027F Figure 2: Global Edible Insects Market Revenues (USD Million), By Insect Type, 2017-2027F Figure 3: Global Edible Insects Market Revenues (USD Million), By Product Type, 2017-2027F Figure 4: Global Edible Insects Market Revenues (USD Million), By End-Users, 2017-2027F Figure 5: Global Edible Insects Market Share By Region, By Revenues, 2021 & 2027F Figure 6: Global Edible Insects Market Attractiveness By Country, 2022-2027F Figure 7: Global Edible Insects Market, Competition Characteristics, 2021 Figure 8: Global Edible Insects Market Share (Percentage), By Competitors, 2021 Figure 9: North America Edible Insects Market Revenues (USD Million), 2017-2027F Figure 10: North America Edible Insects Market Revenues (USD Million), By Insect Type, 2017-2027F Figure 11: North America Edible Insects Market Revenues (USD Million), By Product Type, 2017-2027F Figure 12: North America Edible Insects Market Revenues (USD Million), By End-Users, 2017-2027F Figure 13: North America Edible Insects Market Share By Region, By Revenues, 2021 & 2027F Figure 14: North America Edible Insects Market Attractiveness By Country, 2022-2027F Figure 15: South America Edible Insects Market Revenues (USD Million), 2017-2027F Figure 16: South America Edible Insects Market Revenues (USD Million), By Insect Type, 2017-2027F Figure 17: South America Edible Insects Market Revenues (USD Million), By Product Type, 2017-2027F Figure 18: South America Edible Insects Market Revenues (USD Million), By End-Users, 2017-2027F 14 © 2022 | Reproduction is forbidden | All rights reserved
List of Figures (2/3) List of Figures Figure 19: South America Edible Insects Market Share By Region, By Revenues, 2021 & 2027F Figure 20: South America Edible Insects Market Attractiveness By Country, 2022-2027F Figure 21: Europe Edible Insects Market Revenues (USD Million), 2017-2027F Figure 22: Europe Edible Insects Market Revenues (USD Million), By Insect Type, 2017-2027F Figure 23: Europe Edible Insects Market Revenues (USD Million), By Product Type, 2017-2027F Figure 24: Europe Edible Insects Market Revenues (USD Million), By End-Users, 2017-2027F Figure 25: Europe Edible Insects Market Share By Region, By Revenues, 2021 & 2027F Figure 26: Europe Edible Insects Market Attractiveness By Country, 2022-2027F Figure 27: Middle East & Africa Edible Insects Market Revenues (USD Million), 2017-2027F Figure 28: Middle East & Africa Edible Insects Market Revenues (USD Million), By Insect Type, 2017-2027F Figure 29: Middle East & Africa Edible Insects Market Revenues (USD Million), By Product Type, 2017-2027F Figure 30: Middle East & Africa Edible Insects Market Revenues (USD Million), By End-Users, 2017-2027F Figure 31: Middle East & Africa Edible Insects Market Share By Region, By Revenues, 2021 & 2027F Figure 32: Middle East & Africa Edible Insects Market Attractiveness By Country, 2022-2027F Figure 33: Asia Pacific Edible Insects Market Revenues (USD Million), 2017-2027F Figure 34: Asia Pacific Edible Insects Market Revenues (USD Million), By Insect Type, 2017-2027F Figure 35: Asia Pacific Edible Insects Market Revenues (USD Million), By Product Type, 2017-2027F Figure 36: Asia Pacific Edible Insects Market Revenues (USD Million), By End-Users, 2017-2027F 15 © 2022 | Reproduction is forbidden | All rights reserved
List of Figures (3/3) List of Figures Figure 37: Asia Pacific Edible Insects Market Share By Region, By Revenues, 2021 & 2027F Figure 38: Asia Pacific Edible Insects Market Attractiveness By Country, 2022-2027F 16 © 2022 | Reproduction is forbidden | All rights reserved
Document Outline 02 Research Scope Report Particulars, Key Questions Answered, Market Segmentation, Table of Content Sample Illustration Global Edible Insects Market Research Report: Forecast (2022-2027F) 13 Research Process & Methodology Research Approach, Research Methodology 22 29 Commercials About MarkNtel Advisors Who we are? 31 33 Disclaimer & Contact Details 17 © 2022 | Reproduction is forbidden | All rights reserved
Impact of COVID-19 on Global Edible Insects Market 18 © 2022 | Reproduction is forbidden | All rights reserved
Impact of COVID-19 on Global Edible Insects Market- Regional Analysis XX • Figure XX: Global Edible Insects Market Size (USD Mn), By Region, 2021 XX Europe • XX • 141 XX • 118 XX • North America XX • 102 MEA APAC XX • South America 1,121 3,981 XX • Source: MarkNtel Advisors, Trade and Secondary Press, Company Research, Primary Interviews XX • 19 © 2022 | Reproduction is forbidden | All rights reserved
Impact of COVID-19 on Global Edible Insects Market- Regional Analysis XX • Potential CAGR 2022-27 COVID Adjusted CAGR 2022-27 Net Market Opportunity Gain/Loss 2022-27 XX • XX • X% X% North America X% XX • South America X% X% X% XX • XX • X% X% X% Europe X% X% X% MEA XX • XX • X% X% X% APAC XX • 20 © 2022 | Reproduction is forbidden | All rights reserved
Global Edible Insects Market Trends 21 © 2022 | Reproduction is forbidden | All rights reserved
Global Edible Insects Market Trends & Insights 1 Expansion of Start-up Ecosystem in Western Europe and North America in Edible Insects Market 2 XX 3 XX 4 XX 22 © 2022 | Reproduction is forbidden | All rights reserved
Global Edible Insects Market Dynamics 23 © 2022 | Reproduction is forbidden | All rights reserved
Global Edible Insects Market Dynamics Growth Drivers Challenges 1 1 Integration of Edible Insects in Conventional Western Processed Food Diets Insects Consumption Still Considered as “Imporper” Across the Globe 2 2 XX XX 3 3 XX XX 4 4 XX XX 24 © 2022 | Reproduction is forbidden | All rights reserved
Global Edible Insects Market Strategic Imperatives for Growth & Success 25 © 2022 | Reproduction is forbidden | All rights reserved
Global Edible Insects Market Strategic Imperatives for Success & Growth Consumer Awareness The consumers across the globe are averse to insect consumption as it is largely considered as a disgust, primarily due to varied food cultures. So, the mot vital element for the companies specializing on edible insects offerings in the forthcoming years would be XX XX XX XX XX XX Success Factors XX XX XX XX XX XX XX 26 © 2022 | Reproduction is forbidden | All rights reserved
Global Edible Insects Market Outlook, 2017-2027F 27 © 2022 | Reproduction is forbidden | All rights reserved
Global Edible Insects Market, By Revenues Figure XX: Global Edible Insects Market Revenues (USD Million), 2017-2027F CAGR: XX.XX% CAGR: XX.XX% 2017 2018 2019 2020 2021 2022E 2023F 2024F 2025F 2026F 2027F Source: MarkNtel Advisors, Trade and Secondary Press, Company Research, Primary Interviews Market Synopsis XX • XX • XX • XX • XX • 28 © 2022 | Reproduction is forbidden | All rights reserved
Global Edible Insects Market, By Insect Type Figure XX: Global Edible Insects Market Revenues (USD Million), By Insect Type, 2017-2027F 2017 2018 2019 2020 2021 2022E 2023F 2024F 2025F 2026F 2027F XX XX XX XX XX XX XX XX XX XX XX Crickets XX XX XX XX XX XX XX XX XX XX XX Mealworms XX XX XX XX XX XX XX XX XX XX XX Black Soldier Flies XX XX XX XX XX XX XX XX XX XX XX Buffalo’s XX XX XX XX XX XX XX XX XX XX XX Grasshoppers XX XX XX XX XX XX XX XX XX XX XX Ants XX XX XX XX XX XX XX XX XX XX XX Silkworms XX XX XX XX XX XX XX XX XX XX XX Cicadas XX XX XX XX XX XX XX XX XX XX XX Beetles XX XX XX XX XX XX XX XX XX XX XX Caterpillar XX XX XX XX XX XX XX XX XX XX XX Others Source: MarkNtel Advisors, Trade and Secondary Press, Company Research, Primary Interviews 29 © 2022 | Reproduction is forbidden | All rights reserved
Global Edible Insects Market, By Product Type Figure XX: Global Edible Insects Market Revenues (USD Million), By Product Type, 2017-2027F 2017 2018 2019 2020 2021 2022E 2023F 2024F 2025F 2026F 2027F XX XX XX XX XX XX XX XX XX XX XX Insect Powder XX XX XX XX XX XX XX XX XX XX XX Protein Bars XX XX XX XX XX XX XX XX XX XX XX Whole Insects Source: MarkNtel Advisors, Trade and Secondary Press, Company Research, Primary Interviews Market Synopsis XX • XX • XX • XX • XX • XX • XX • 30 © 2022 | Reproduction is forbidden | All rights reserved
Global Edible Insects Market, By End-Users Figure XX: Global Edible Insects Market Revenues (USD Million), By End-Users, 2017-2027F 2017 2018 2019 2020 2021 2022E 2023F 2024F 2025F 2026F 2027F XX XX XX XX XX XX XX XX XX XX XX Human Consumption XX XX XX XX XX XX XX XX XX XX XX Animal Feed XX XX XX XX XX XX XX XX XX XX XX Agriculture Source: MarkNtel Advisors, Trade and Secondary Press, Company Research, Primary Interviews Market Synopsis XX • XX • XX • XX • XX • XX • XX • 31 © 2022 | Reproduction is forbidden | All rights reserved
Global Edible Insects Market, By Region Figure XX: Global Edible Insects Market Share By Region, By Revenues, 2021 & 2027F 2021: X% 2027F: X% Europe North America 2021: X% Asia Pacific 2027F: X% Middle East & Africa 2021: X% 2027F: X% South America 2021: X% 2021: X% 2027F: X% 2027F: X% Source: MarkNtel Advisors, Trade and Secondary Press, Company Research, Primary Interviews 32 © 2022 | Reproduction is forbidden | All rights reserved
Global Edible Insects Market, By Country Figure XX: Global Edible Insects Market Attractiveness By Country, 2022-2027F High Market Size X Most Attractive Markets to Invest During 2022-27 X X The United States Challengers Leaders Market Size (USD Mn) Laggards Visionaries X X Low Market Size Low Growth High Growth X% X% X% X% X% CAGR 2022-27 (Percentage) Source: MarkNtel Advisors, Trade and Secondary Press, Company Research, Primary Interviews 33 © 2022 | Reproduction is forbidden | All rights reserved
Global Edible Insects Market, By Company Figure XX: Global Edible Insects Market, Competition Characteristics, 2021 Sr. No. Particulars Description 1. Competition Concentration Highlights • XX 2. Number of Companies in the Market • XX+ 3. Competitive Factors • XX 4. Key End UserGroups • Aviation 5. Major Market Participants LG Chem, XX, XX, XX, XX • 6. Market Share of Top 5 Competitors • X% 7. Other Notable Participants • XX, XX, XX, XX 8. Notable Strategic Events • XX Source: MarkNtel Advisors, Trade and Secondary Press, Company Research, Primary Interviews 34 © 2022 | Reproduction is forbidden | All rights reserved
Global Edible Insects Market, By Competitors Figure XX: Global Edible Insects Market Share (Percentage), By Competitors, 2021 Others (USDX Million) AgriProteinTechnologies (USDX Million) XX XX XX XX XX(USDX Million) XX(USDX Million) USDX Million XX XX XX XX XX(USDX Million) XX(USDX Million) XX XX XX XX Source: MarkNtel Advisors, Trade and Secondary Press, Company Research, Primary Interviews 35 © 2022 | Reproduction is forbidden | All rights reserved
North America Edible Insects Market Outlook, 2017-2027F 36 © 2022 | Reproduction is forbidden | All rights reserved
North America Edible Insects Market, By Revenues Figure XX: North America Edible Insects Market Revenues (USD Million), 2017-2027F CAGR: XX.XX% CAGR: XX.XX% 2017 2018 2019 2020 2021 2022E 2023F 2024F 2025F 2026F 2027F Source: MarkNtel Advisors, Trade and Secondary Press, Company Research, Primary Interviews Market Synopsis XX • XX • XX • XX • XX • 37 © 2022 | Reproduction is forbidden | All rights reserved
North America Edible Insects Market, By Insect Type Figure XX: North America Edible Insects Market Revenues (USD Million), By Insect Type, 2017-2027F 2017 2018 2019 2020 2021 2022E 2023F 2024F 2025F 2026F 2027F XX XX XX XX XX XX XX XX XX XX XX Crickets XX XX XX XX XX XX XX XX XX XX XX Mealworms XX XX XX XX XX XX XX XX XX XX XX Black Soldier Flies XX XX XX XX XX XX XX XX XX XX XX Buffalo’s XX XX XX XX XX XX XX XX XX XX XX Grasshoppers XX XX XX XX XX XX XX XX XX XX XX Ants XX XX XX XX XX XX XX XX XX XX XX Silkworms XX XX XX XX XX XX XX XX XX XX XX Cicadas XX XX XX XX XX XX XX XX XX XX XX Beetles XX XX XX XX XX XX XX XX XX XX XX Caterpillar XX XX XX XX XX XX XX XX XX XX XX Others Source: MarkNtel Advisors, Trade and Secondary Press, Company Research, Primary Interviews 38 © 2022 | Reproduction is forbidden | All rights reserved
North America Edible Insects Market, By Product Type Figure XX: North America Edible Insects Market Revenues (USD Million), By Product Type, 2017-2027F 2017 2018 2019 2020 2021 2022E 2023F 2024F 2025F 2026F 2027F XX XX XX XX XX XX XX XX XX XX XX Insect Powder XX XX XX XX XX XX XX XX XX XX XX Protein Bars XX XX XX XX XX XX XX XX XX XX XX Whole Insects Source: MarkNtel Advisors, Trade and Secondary Press, Company Research, Primary Interviews Market Synopsis XX • XX • XX • XX • XX • XX • XX • 39 © 2022 | Reproduction is forbidden | All rights reserved
North America Edible Insects Market, By End-Users Figure XX: North America Edible Insects Market Revenues (USD Million), By End-Users, 2017-2027F 2017 2018 2019 2020 2021 2022E 2023F 2024F 2025F 2026F 2027F XX XX XX XX XX XX XX XX XX XX XX Human Consumption XX XX XX XX XX XX XX XX XX XX XX Animal Feed XX XX XX XX XX XX XX XX XX XX XX Agriculture Source: MarkNtel Advisors, Trade and Secondary Press, Company Research, Primary Interviews Market Synopsis XX • XX • XX • XX • XX • XX • XX • 40 © 2022 | Reproduction is forbidden | All rights reserved
The United States Edible Insects Market Outlook, 2017-2027F 41 © 2022 | Reproduction is forbidden | All rights reserved
The United States Edible Insects Market, By Revenues Figure XX: The United States Edible Insects Market Revenues (USD Million), 2017-2027F CAGR: XX.XX% CAGR: XX.XX% 2017 2018 2019 2020 2021 2022E 2023F 2024F 2025F 2026F 2027F Source: MarkNtel Advisors, Trade and Secondary Press, Company Research, Primary Interviews Market Synopsis XX • XX • XX • XX • XX • 42 © 2022 | Reproduction is forbidden | All rights reserved
Document Outline 02 Research Scope Report Particulars, Key Questions Answered, Market Segmentation, Table of Content Sample Illustration Global Edible Insects Market Research Report: Forecast (2022-2027F) 13 Research Process & Methodology Research Approach, Research Methodology 22 29 Commercials About MarkNtel Advisors Who we are? 31 33 Disclaimer & Contact Details 43 © 2022 | Reproduction is forbidden | All rights reserved
Research Methodology – Overview 01 • Finalize the scope after feasibility checks on information availability & consultation with industry experts 02 • Finalize the sample size of industry experts to be interviewed 03 • First level Primary Research with industry experts, preferably the mid senior executives. 04 • Plotting raw data in MS- Excel 05 • Second Level Validation of Insights obtained using primary & secondary research again 06 • All the primary & secondary research insights are included in the final report writing • Market Trend Analysis for Data Cleaning • Identify the third-party secondary databases to be used amongst Gartner, Factset, Factiva, D&B Hoovers, etc. • Secondary Sources like News, Associations, Third Party Databases, Competitor Regulatory Filings, etc. • Bottom-up & Top- down Approach • Industry experts' feedback & comments are carefully scrutinized, and included to improve the research quality • Develop research roadmap, execution plan, timelines, team deployment, etc. • Data Modeling to forecast and estimate the market size (linear statistical tools, etc.) Scope & Research Design Sample Selection Data Collection Data Analysis Data Validation Report Writing 44 © 2022 | Reproduction is forbidden | All rights reserved
Research Methodology – Data Sources for Secondary Research Industry Associations Equity Research Reports Company Websites Marketing Collaterals, Corporate Presentations Company Filings & Annual Reports Strategic Crush Reports News Searches, Press Releases Technical Journals Business Magazines In-house Data Repository • • • • • • • • • • Gartner Forrester Bloomberg S&P Capital IQ Thomson Reuters Factiva D&B OneSource Celent OVUM • • • • • • • • • Database Capabilities LinkedIn Premium SignalHire Zoom Info MEED Construction Week BNC Network • • • • • • 45 © 2022 | Reproduction is forbidden | All rights reserved
Research Methodology – Primary Research Type of Respondents Interviewed We estimate a total of ~105 online/telephonic meetings across industry stakeholders 10% 15% Engage with ~1-2 government bodies active in Edible Insects industry across the globe (for market outlook & insights) • Reach out to ~50 employees/ex employees/CXOs from Edible Insects supplying companies (for market sizing) • 35% Top Suppliers 40% Government Bodies C Level Executive Mid Senior Executives Senior Executives Others Primary Respondents Engage with ~40 distributors & retailers of leading companies engaged in sale of Edible Insects across the globe (for customer buying journey & end-user analysis) (sample will be evenly sourced across all the regions) • Distributors & Retailers Geography Wise Respondents Subject Matter Experts 20% Engage with 2-3 SMEs (worked for Edible Insects companies and have a good experience) in Edible Insects to know more on customer buying journey & industry outlook • 40% 5% End Users 30% 5% Reach out to end user to gauge consumer buying pattern, customer touch point & consumer mix (sample will be evenly sourced across major industry domains) • North America Europe Asia-Pacific South America Middle East & Africa 46 © 2022 | Reproduction is forbidden | All rights reserved
Research Methodology – Primary Research Collaboration with 3rdparty agencies to schedule interviews for us with industry experts for statistical insights & other qualitative inputs. Experts are paid for the information shared. Mutual confidentiality is ensured for a win-win situation Expert Agency Global Edible Insects Market Check for the key department through primary research (R&D, Sales, Product Development, Supply Chain, Production, among others) Primary Research (In-house) Identification of major Edible Insects providers Triangulate information with proxy methods to pull out key insights from analysis of the data gathered through paid interviews and desk research. Check for relevant designations (CXOs, Vice President, Directors, R&D Heads, Supply Chain Managers, Procurement Heads, Production Heads, Technology Leads, and Innovation Directors, among others Relevant Contact found? Yes No Seek for appointment or complete the call Ask for reference (emails & contact number) Relevant information found? Yes, Partial Yes No Check for more information either through follow up calls or emails Consider the call as a successful interview Ask for reference (email & contact number) End Yes 47 © 2022 | Reproduction is forbidden | All rights reserved
Research Methodology- Market Estimation We mapped the offerings in Edible Insects market & forecast till 2027F Top-down Analysis Secondary research & primary interviews (S + P) Global Edible Insects Market Top to Bottom Approach Bottom to Top (S + P) Bottom-up Analysis Analyze the top competitors operating in Global Edible Insects industry and their market share By Value Competitor 1 Competitor 2 Competitor 3 • Revenues generated by the company from selling Edible Insects • Revenues generated by the company from selling Edible Insects • Revenues generated by the company from selling Edible Insects By End Users Primary and expert interviews (P + E) End User 1 End User 2 End User 3 Extrapolate the overall market (Data modelling) Based on market share and revenue of competitor 1 Based on market share and revenue of competitor 2 Based on market share and revenue of competitor 3 Primary and expert interviews (P + E) Average out to get the overall market size of Edible Insects 48 © 2022 | Reproduction is forbidden | All rights reserved
Research Methodology- Market Estimation Forecasting Methodology The analysis conducted is based on actual operating data from selected samples. The historical data is extracted based on company filings, primary research, estimation models, in-house & paid databases, local and international statistics,and desk research. • The forecasting methodology is based on an analysis of rolling averages, trend estimation & extrapolation. Anticipated events expected to shape the future dynamics of supply & demand are identified then weighted against relevance and impact, thereby forecasting the performance of the relevant market. • Monthly and annual historical data trends from the past 5 or 10 years are analyzed to identify demand patterns, and is utilized as a forecasting base • Knowledge contributors / Industry consultants are requested to suggest the company forecast, and expected industry trends. All the factors above are given weightage in the final forecasting estimation. • The statistical forecasting models such as moving averages, single variate & multivariate regression analysis, time series analysis, regression analysis, etc., are utilized to present the forecast for the next few years. • Forecast Models Used by the Team Rolling Averages Exponential Smoothing Time Series & Regression Analysis Decomposition Forecasting Hybrid Forecasting Spectral Analysis 49 © 2022 | Reproduction is forbidden | All rights reserved
Data Triangulation Development of appropriate Data model after understanding the market dynamics Estimating the demand & supply measuring the market using several assumptions best explaining the market Embed the inputs from primary & secondary research to develop an extensive and accurate data model Validate the final findings with the primary respondents once again • • • Data Analysis • Interviews with Industry Experts: • Key Vendors • Channel Partners • End Users • Other industry leaders (Freelance Consultants, etc.) Financial Disclosures Industry Associations News Articles & Magazines Journals & Research Papers Paid Databases • • • • • • Primary Research Secondary Research 50 © 2022 | Reproduction is forbidden | All rights reserved