1 / 92
920 likes | 938 Views
With data growing at a rapid rate, companies are facing significant challenges to handle their data and derive business values. Implementing the use of Data Analysis tools is the need of the hour. In this video, we'll cover the top 10 data analysis tools that can help you handle your data efficiently, perform different kinds of analytics, build reports, dashboards, and models to make business decisions. You will also learn their essential features and the companies that use them regularly. <br>

E N D
Why Data Analysis? Numerous companies around the globe produce a huge amount of data intelligence!
Why Data Analysis? All the generated data in its raw form is of no use to anyone. It is of use only if we can derive meaningful information from it
Why Data Analysis? All the generated data in its raw form is of no use to anyone. It is of use only if we can derive meaningful information from it To do this, we use Data Analysis!
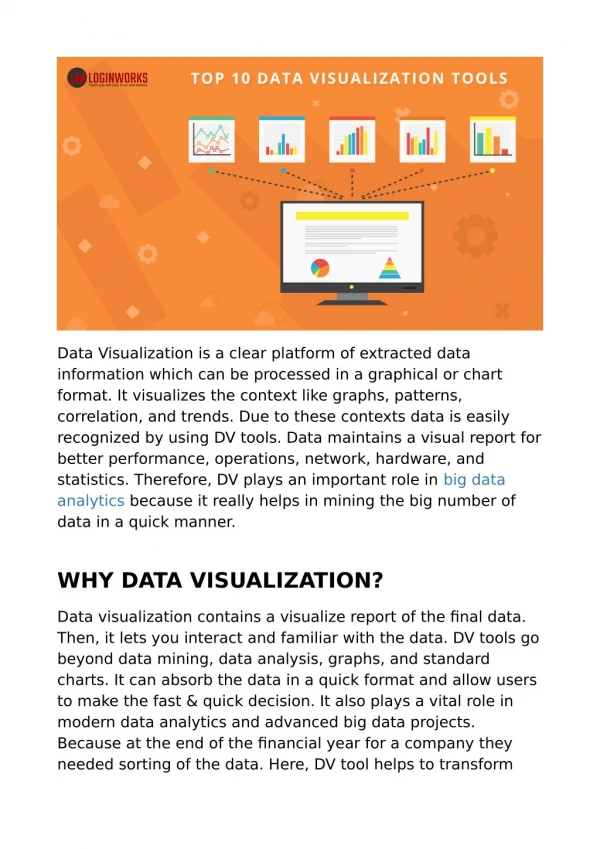
What is Data Analysis? Data Analysis is the process of collecting, cleaning, and transforming data into useful information
What is Data Analysis? We can achieve this with the help of various data analysis tools. These tools provide the analysis results visually
10. Microsoft Excel Developed by Microsoft, the Microsoft excel is a spreadsheet program which is used to create grids of numbers, texts and various formulae
10. Microsoft Excel Features
10. Microsoft Excel Features • Excel can be used with every piece of software in Microsoft Office
10. Microsoft Excel Features • Excel can be used with every piece of software in Microsoft Office • It supports programming through VBA which enables spreadsheet manipulations
10. Microsoft Excel Features • Excel can be used with every piece of software in Microsoft Office • It supports programming through VBA which enables spreadsheet manipulations • Microsoft Excel allows you to display analysis results in the form of line graphs, charts, and histograms. The visualization can be generated from specified group of cells
10. Microsoft Excel Companies using Excel
9. RapidMiner RapidMiner is a dedicated data science software platform which helps with data preparation and analysis
9. RapidMiner Features
9. RapidMiner Features • RapidMiner allows developers to use the drag and drop option to operate on pieces of code when building models
9. RapidMiner Features • RapidMiner allows developers to use the drag and drop option to operate on pieces of code when building models • It has various data exploration features which are used by users to gain valuable insights from the data
9. RapidMiner Features • RapidMiner allows developers to use the drag and drop option to operate on pieces of code when building models • It has various data exploration features which are used by users to gain valuable insights from the data • RapidMiner provides more than 1500 operators for data analysis and transformations
9. RapidMiner Companies using RapidMiner
8. Talend Talend was founded with the vision to modernize data integration. Various services for data management is provided by Talend
8. Talend Features
8. Talend Features • Talend allows quick deployment by means of automation
8. Talend Features • Talend allows quick deployment by means of automation • It offers open source tools which can be downloaded for free
8. Talend Features • Talend allows quick deployment by means of automation • It offers open source tools which can be downloaded for free • Talend enables you to integrate with many databases, SaaS, and technologies
8. Talend Companies using Talend
7. KNIME KNIME is an open-source data analysis tool to create data science applications and build machine learning models
7. KNIME Features
7. KNIME Features • KNIME provides a GUI to create visual workflows using the drag and drop feature
7. KNIME Features • KNIME provides a GUI to create visual workflows using the drag and drop feature • It supports multi-threaded in-memory data processing
7. KNIME Features • KNIME provides a GUI to create visual workflows using the drag and drop feature • It supports multi-threaded in-memory data processing • KNIME Server automates workflow execution and supports team-based collaboration
7. KNIME Companies using KNIME
6. SAS Statistical Analysis System (SAS) is a software developed by the SAS institute. SAS is used to analyze statistical data
6. SAS Features
6. SAS Features • SAS enables better data analysis using SAS SQL and automatic code generation
6. SAS Features • SAS enables better data analysis using SAS SQL and automatic code generation • SAS allows easy integration with MS office tools like outlook and excel
6. SAS Features • SAS enables better data analysis using SAS SQL and automatic code generation • SAS allows easy integration with MS office tools like outlook and excel • SAS enables you to create interactive dashboards and reports by helping you understand complex data
6. SAS Companies using SAS