Download
1 / 92
1.01k likes | 1.47k Views
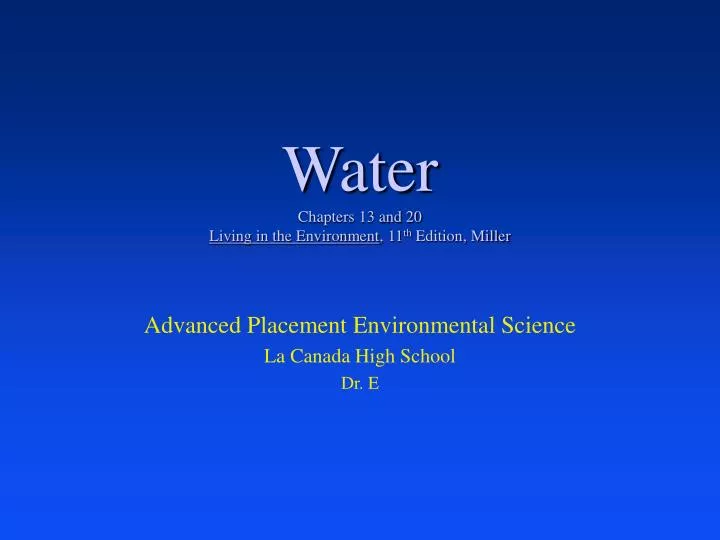
Water Chapters 13 and 20 Living in the Environment , 11 th Edition, Miller. Advanced Placement Environmental Science La Canada High School Dr. E. Key H 2 0 Characteristics. Water is the prime constituent of all living organisms.

E N D
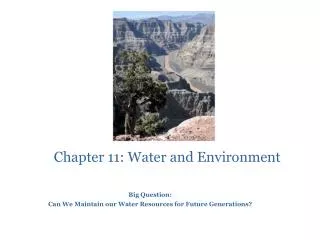
WaterChapters 13 and 20Living in the Environment, 11th Edition, Miller Advanced Placement Environmental Science La Canada High School Dr. E
Key H20 Characteristics • Water is the prime constituent of all living organisms. • Water moves easily-from one physical state to another, and from one place to another. • Water slowly absorbs and releases large quantities of energy. • Water is a superior solvent. • Michael D. Lee Ph.D. Geography and Environmental Studies (Source: Wright & Nebel 2002)
Importance of Water Properties Running water can quickly erode topsoil rendering farmland infertile and streams contaminated. Lack of access to clean water supplies can quickly lead to dehydration and death. Chemical spills, excess nutrients & acids dissolved in H20 can lead to massive die offs. Michael D. Lee Ph.D. Geography and Environmental Studies
Water • Supply, Renewal and Use • Too little Water • Dams and Reservoirs • Transferring water • Groundwater and Saltwater • Efficiency • Too Much Water • Water Pollution
Available Water • Total = 326 million cubic miles • 97% of Earth’s water is in oceans • 2.997% is locked up in ice caps and glaciers • 0.003% is easily accessible • Soil moisture • Groundwater • Water vapor • Lakes • Streams
Water Supply & Use http://ga.water.usgs.gov/edu/waterdistribution.html
Water Cycle www.athensclarkecounty.com/~stormwater/ SW%20Management.htm
Hydrologic Cycle • Powered by solar energy and gravity • Evaporation and precipitation • Continuous recycling of water • Runoff • Infiltration • Evaporation • Temporary storage as snow and ice • Temporary storage in lakes • Temporary storage in plants (transpiration) and animals • Chemical reactions with rocks and minerals • Volcanism also causes melting of snow caps and mudflows as melted water mixes with ash • Source of additional water? volcanism (steam)
Surface Water • Surface runoff flows into streams, lakes, wetlands and reservoirs • A watershed or drainage basin • Region that drains into a streams, lakes, wetlands or reservoirs www.canaanvi.org/assistance/ watershed.asp
Groundwater • As precipitation infiltrates and percolates through voids in soil and rock • Pores, fractures, crevices, etc. • Shallow rock has little moisture • Zone of saturation is at a depth were ground is filled with water • Top of this zone is water table • Falls in dry weather • Rises in wet weather
HOW RIVERS WORK: the role of groundwater www.elmhurst.edu/.../chm110/ outlines/groundwater.html
Aquifers • Porous, water-saturated layers of sand, gravel or bedrock through which groundwater flows • Area of land that supplies water to aquifer is called the recharge area • Natural recharge is when water percolates downward, but sometimes lateral recharge occurs
Groundwater Movement • Groundwater moves from recharge area through an aquifer and out a discharge area • well, spring, lake, geyser, artesian well, steam, ocean • Normally moves downhill at only a meter per year • Some aquifers get little recharge and were formed thousands of years ago • Removal from these nonrenewable resources is called water mining
Use of Fresh Water • United States • 41% agriculture • 38% power plant cooling • 11% industry • 10% public • China • 87% agriculture • 7% industry • 6% public
Water Use Globally People and Planet • 70 per cent of all water withdrawn for human use on an annual basis is soaked up by agriculture (mostly in the form of irrigation) • Industry accounts for 23 per cent • Domestic use (household, drinking water, sanitation) accounts for about 7 per cent
Water Use People and Planet • The average person needs a minimum of five litres (1.3 gallons) of water per day to survive in a moderate climate at an average activity level, according to UN figures. • The minimum amount of water needed for drinking and cooking, bathing and sanitation is 50 litres (13 gallons).
Water Use - (minimum 13 gallons) People and Planet • The average person in the United States uses between 250 to 300 litres of water (65-78 gallons) per day for drinking, cooking bathing, and watering their yard. • The average person in the Netherlands uses 104 litres per day (27 gallons). • The average person in the African nation of Gambia uses 4.5 litres per day (1.2 gallons of water).
Water Use - United States • In 1990, about 408,000 million gallons (Mgal/d) of water were used each day • Of that, about 339,000 Mgal/d was fresh water and about 69,400 Mgal/d was saline water • California used the most water, about 46,800 Mgal/d, with most of that going towards irrigation • The state with the second-highest water use was Texas, with about 25,200 Mgal/d, mostly for use in the power-production industries and for irrigation
Some conversions: • 1 Mgal/d = 1.547 cubic feet per second • 1 Mgal/d = 0.6944 thousand gallons per minute • 1 Mgal/d = 1,121 thousand acre-feet per year • 1 million gallons = 3.07 acre feet http://ga.water.usgs.gov/edu/wateruse.html
Water • Supply, Renewal and Use • Too little Water • Dams and Reservoirs • Transferring water • Groundwater and Saltwater • Efficiency • Too Much Water • Water Pollution
Too Little Water • Causes • Dry climate • Drought - a period in which precipitation is much lower and evaporation is much higher • Desiccation - drying of soil because of such activities as deforestation and overgrazing • Water stress - low per capita availability of water caused by overpopulation
Precipitation Varies Greatly • US cities vary in their precipitation from an average of less than 8 to 60 inches a year. • Globally, the extreme is even greater – averages of less than 1 inch to more than 70 inches per year. • However, this masks variations between years. • Some locations may get ten times more, or less than 1/10 of their annual average from year to year. • Meeting demands for water when precipitation is so highly varied creates many challenges.
www.geocities.com/seafloormapping2/ atmos.htm whyfiles.org/131fresh_water/ 2.html
Global Precipitation Patterns Wright and Nebel, 2002. Michael D. Lee Ph.D. Geography and Environmental Studies
http://www.peopleandplanet.net/graphs/Freshwateravailability.jpghttp://www.peopleandplanet.net/graphs/Freshwateravailability.jpg
In most areas of Nevada and California, potential transpiration and evaporation is in excess of precipitation, which causes a net moisture deficit
Drought may spark food price hikeTuesday, November 12, 2002 SYDNEY, Australia -- All but one percent of Australia's most populous state, New South Wales, has been bit by the country's worst drought in a century, with retailers warning that if rain does not fall soon, the country will likely face massive food price hikes.
Water • Supply, Renewal and Use • Too little Water • Dams and Reservoirs and • Transferring water • Groundwater and Saltwater • Efficiency • Too Much Water • Water Pollution
Water and Civilization • Many anthropologists and historians believe the need to manage water played a major role in the development of early systems of government. • In Mesopotamia, the Fertile Crescent where the Tigris and Euphrates Rivers come together, water allowed the rise of irrigation-based agriculture, but this required coordination and rules to permit equitable access to water downstream. • Proto-laws and governments were thus developed some 4,400 years BP • Ancient communities that prospered were those that generally well managed their water supplies. Michael D. Lee Ph.D. Geography and Environmental Studies
Examples of Water Management • Many civilizations built impressive water management systems – to bring water to places where people wanted to be or where crops could be grown, but where it was naturally insufficient. • Egyptians built dykes, canals and water lifts to extend agricultural limits. • Middle East and North African nomads built qanats (underground chain wells). • Nabateans built runoff harvesting systems – cisterns and flood terraces. • Incas built canals to catch snowmelt from the Andes to the coastal desert, and terraces to flood for farming. • Romans built municipal aqueducts and sewers to serve burgeoning settlements. • For a good, fun site on water history go here. Michael D. Lee Ph.D. Geography and Environmental Studies
Egyptians perfected the shadouf to draw water from canals and the river to the adjacent bank and into ditches. Michael D. Lee Ph.D. Geography and Environmental Studies Nomadic herders and, later, sedentary civilizations developed chains of wells – qanats, karez, foggaras, falaj – to route water across miles of desert from distant aquifers.
Water for Power • In addition to its uses for municipal purposes (drinking, sanitation, etc.) and for farming, moving water also has tremendous power to do work. • This too has been harnessed for millennia – first to lift water out of the river itself, then to grind grain and turn gears for machinery like looms, and then for electricity. • Water wheels have been in use for more than 2,000 years and were thought to have been a major factor in the advancement of European societies in the middle ages, as labor was freed for other purposes than farming. • Following the discovery of electricity and the pioneering of electric light by Edison, in the 1880s hydropower systems were built to generate electricity to send through transmission lines to homes and businesses. Michael D. Lee Ph.D. Geography and Environmental Studies
Example of noria – water driven wheels lifting water into irrigation ditches or elevated aqueducts (This is in Vietnam) Slaters Mill in Rhode Island, one of the earliest American water powered industrial systems. Artists impression of the Three Gorges Project, Yangtze River, China – world’s biggest hydropower project 19 m kW. Michael D. Lee Ph.D. Geography and Environmental Studies
Increasing Water Supplies • Build dams and reservoirs to store runoff • Bring in surface water from another area • Withdraw groundwater • Convert salt water to fresh water (desalination) • Improve the efficiency of water use
Aswan Dam, Egypt Chinese Dam Fish Bypass System Earthen Dam Hoover Dam www.wvic.com/res-main.htm
Large Dams - Pros • Collect and store water from rain and snow • Produce electricity • Irrigate land below the dam • Control flooding • Provide water to cities, towns and rural areas • Provide recreational activities such as swimming, boating, fishing
Large Dams - Cons • Enormous loss of water due to evaporation • Mass of water can cause earthquakes • Flooded land destroys forests or cropland and displaces people • Danger of Dam collapse • Downstream areas deprived of nutrient-rich soil, which will eventually clog the reservoir • Migration and spawning of fish disrupted • Expensive to build
Case Study: California CSU HaywardDept. Geography and Environmental StudiesGEOG 4350 Fall 2001 Class 6 isis.csuhayward.edu/alss/geography/ mlee/geog4350/4350c6f01.ppt
Most of the land in Nevada and southern California is desert shrubland, because these areas receive little precipitation. By contrast, wetter areas of central and northern California are forested where mountainous and developed as farmland and urban areas are flatter
California’s Water • Water Law • California’s Water Projects • Los Angeles Aqueduct • Hetch-Hetchy • Salton Sea • Colorado Aqueduct • Central Valley Project
Water Law • Riparian Rights (Sharing) • from English Common Law • applies to surface waters • owner of waterfront land to use amounts correlated with other riparian owners. • Works well in areas with water surplus • Prior Appropriation (1st come, first served) • from Spanish law • no preference given to those adjoining water course • water rights based on use; earliest has rights • use protected as long as it is continuous and “reasonable”
Water Law • Correlative Rights • applies to ground water • about 40% of all California water (not a sustainable withdraw) • Overlying landowners entitled to “reasonable” use. Rights are correlated with other landowners overlying the aquifer • The California Doctrine • 1928 amendment to California Constitution • “Most reasonable beneficial use” • Blend of riparian and appropriation rights • Problem: California water geography is unbalanced. Plenty of water in the north. Most people in the south.
California Water Code • Highest priority for domestic use • Second priority goes to irrigation • Applications by municipalities for use of water by residents given priority over most other uses. • Water Board determines allocation to serve public interest. Board must work within state water plans. • Owens Valley issue highlights how contentious this process can be.
Los Angeles Aqueduct (DWP)Eastern Sierra • Started in 1908 by William Mulholland • appropriated water feeding Owens Valley • taps surface flow from Eastern Sierra south • 250 miles, cost $25,000,000 and took five years • pipe and flume, tunnel, and trench • gravity feed, no pumping • generates hydroelectric power • L.A. purchased riparian land, used appropriation rights to get away with this. Ranchers in Owens Valley fought back with dynamite and guns - California’s only range war.
Mono Lake • In 1941, L.A. DWP started diverting Mono Basin streams to add to L.A. Aqueduct. • Mono Lake’s volume halved while salinity doubled. The simple ecosystem began to fail and threatened migrating birds and nesting gulls. • The state and courts now mandate raising the level of the lake 17 feet. It will take about 20 years.
Hetch Hetchy:San Francisco Water • Hetch Hetchy Valley, in Yosemite National Park, damned. Completed in 1931. • 175 mile aqueduct and O’Shawnasy Dam, powerhouse, provide cheap power to the city of San Francisco. • 95 mile Mokelumne aqueduct, starts at Pardee Dam and reservoir. • Together they provide about 1/3 of Bay Area water. • Controversy helped to strengthen John Muir’s Sierra Club.