Download
1 / 31
310 likes | 446 Views
Selling Environment or Market Structure. Chapter 9-2. Laugher Curve. In Canada, there is a small radical group that refuses to speak English and no one can understand them. They are called “separatists.”. Laugher Curve. In the United States we have the same kind of group.

E N D
Selling Environment or Market Structure Chapter 9-2
Laugher Curve In Canada, there is a small radical group that refuses to speak English and no one can understand them. They are called “separatists.”
Laugher Curve In the United States we have the same kind of group. They are called “economists.” — Nations Business
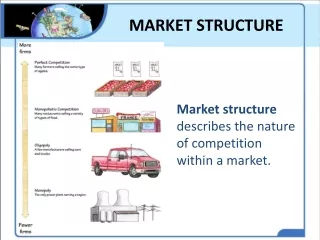
Introduction • Market structure is the focus real-world competition. • Market structure refers to the physical characteristics of the market within which firms interact.
Introduction • Market structure involves the number of firms in the market and the barriers to entry.
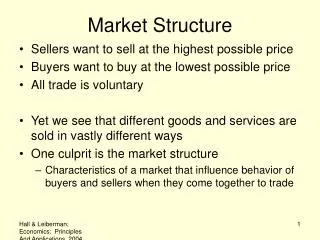
Market Structure • The selling environment in which a firm produces and sells its product is called a market structure. • Defined by three characteristics: • The number of firms in the market • The ease of entry and exit of firms • The degree of product differentiation From your book!
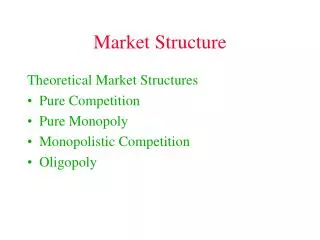
Introduction • Perfect competition, with an infinite number of firms, and monopoly, with a single firm, are polar opposites. • Monopolistic competition and oligopoly lie between these two extremes.
Perfect Competition • Perfect Competition is a market structure characterized by: • Many large firms, so large that no one firm has the ability to affect the market. These firms are pricetakers—they have to go along with the market price. • Identical products,the products are identical, generic products. • Easy entry into the industry. • The demand curve is perceived by each firm to be horizontal. From your book!
Monopoly • Monopolyis a market structure in which thereis just one firm, and entry by other firms is not possible. • There are no close substitutes. • The firm has the power to set the price, but still sets an optimal price to maximize profit. If the monopolist sets the price too high, revenue will decline. The firm is a price maker. • The firm’s demand curve is the market demand curve, and it is downward sloping.
Introduction • Monopolistic competition is a market structure in which there are many firms selling differentiated products. • There are few barriers to entry.
Monopolistic Competition • Monopolistic Competition is characterized by: • A large number of firms • Easy entry • Differentiated products,because each firm’s product is slightly different, each firm is kind of a mini-monopoly—the only producer of that specific product. • This allows the firm to be a price maker. • The firm’s demand curve is downward sloping and depending on the differentiation of the firm’s product, it may be fairly inelastic.
Introduction • Oligopoly is a market structure in which there are a few interdependent firms. • There are often significant barriers to entry.
Oligopoloy • Oligopoly is characterized by: • Fewfirms—more than one, but few enough so each firm alone can affect the market. • Entry is more difficult, but can occur. • The firms areinterdependent—each is affected by what others do. • The demand curve is downward sloping for each firm.
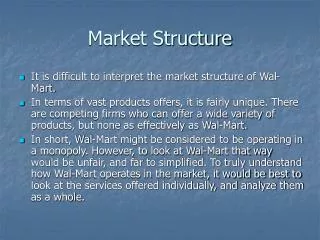
Problems Determining Market Structure • Defining a market has problems: • What is an industry and what is its geographic market -- local, national, or international? • What products are to be included in the definition of an industry? Summarizing it for you!
Classifying Industries • One of the ways in which economists classify markets is by cross-price elasticities. • Cross-price elasticity measures the responsiveness of the change in demand for a good to change in the price of a related good. Not in your book but good to know!
Classifying Industries • Industries are classified by government using the North American Industry Classification System (NAICS). • The North American Industry Classification System (NAICS) is a classification system of industries adopted by Canada, Mexico, and the U.S. in 1997.
Classifying Industries • When economists talk about industry structure the general practice is to refer to three-digit industries. • Under the NAICS, a two-digit industry is a broadly based industry. • A three-digit industry is a specific type of industry within a broadly defined two-digit industry.
Determining Industry Structure • Economists use one of two methods to measure industry structure: • The concentration ratio. • The Herfindahl index.
Concentration Ratio • The concentration ratio is the value of sales by the top firms of an industry stated as a percentage of total industry sales.
Concentration Ratio • The most commonly used concentration ratio is the four-firm concentration ratio. • The higher the ratio, the closer to an oligopolistic or monopolistic type of market structure.
The Herfindahl Index • The Herfindahl indexisan index of market concentration calculated by adding the squared value of the individual market shares of all firms in the industry.
The Herfindahl Index • The Herfindahl index gives higher weights to the largest firms in the industry because it squares market shares.
The Herfindahl Index • The Herfindahl Index is used as a rule of thumb by the Justice Department to determine whether a merger be allowed to take place. • If the index is less than 1,000, the industry is considered competitive thus allowing the merger to take place.
Conglomerate Firms and Bigness • Neither the four-firm concentration ratio or the Herfindahl index gives a complete picture of corporations’ bigness.
The Importance of Classifying Industry Structure • The less concentrated industries are more likely to resemble perfectly competitive markets.