Download
1 / 15
150 likes | 530 Views
Lecture 15: Continuous-Time Transfer Functions. 6 Transfer Function of Continuous-Time Systems (3 lectures): Transfer function, frequency response, Bode diagram. Physical realisability, stability. Poles and zeros, rubber sheet analogy. Specific objectives for today:

E N D
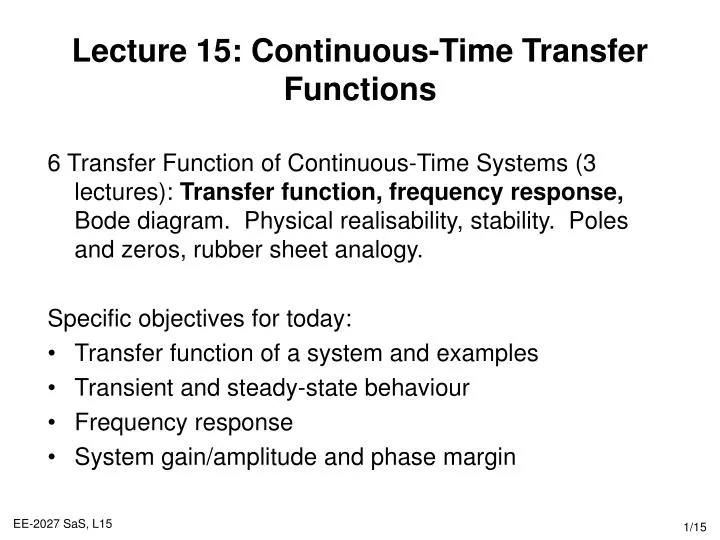
Lecture 15: Continuous-Time Transfer Functions • 6 Transfer Function of Continuous-Time Systems (3 lectures): Transfer function, frequency response, Bode diagram. Physical realisability, stability. Poles and zeros, rubber sheet analogy. • Specific objectives for today: • Transfer function of a system and examples • Transient and steady-state behaviour • Frequency response • System gain/amplitude and phase margin
Lecture 15: Resources • Core material • SaS, O&W, C3.8-3.10 • Background material • MIT Lectures 9
System/Transfer Functions • The system/transfer function, H(s), is defined as the Laplace transform of the system’s impulse response • When s=jw, this is the Fourier transform and more generally, this is the Laplace transform • The transfer function is very important because • the unknown system output (Laplace transform) is given by the multiplicationX(s) and H(s) x(t)=d(t) y(t)=h(t) H(s) x(t) y(t) H(s)
Example 1: First Order System • Consider a general LTI, first order, differential equation with an impulse input • Taking Laplace transforms • which gives the system’s transfer function, H(s). This can be solved to show that (see earlier examples)
Example 2: Second Order System • Consider a general LTI, second order, differential equation with an impulse input • Taking Laplace transforms • which gives the system’s transfer function, H(s). This can be solved, using partial fractions, to show that
Transfer Functions & System Eigenfuctions • Remember that x(t)=est is an eigenfuction of an LTI system with corresponding eigenvalue H(s) • In addition, by Laplace theory, most input signals x(t) can be expressed as a linear combination of basis signals est (inverse Laplace transform): • Therefore the system’s output can be expressed as • which is why Y(s)=H(s)X(s), again using the transfer function x(t)=est y(t)=H(s)est H(s)
Frequency Response Analysis • Of particular interest is frequency response analysis. This corresponds to input signals of the form • and the corresponding transfer function is • In this case s=jw, the transfer function corresponds to the Fourier transform. It is a complex function of frequency. • Example when x(t) is periodic, with fundamental frequency w0, the Fourier transform is given by: • The system’s response is given by
Example: 1st Order System and cos() Input • The transfer function of a 1st order system is given by: • The input signal x(t)=cos(w0t), which has fundamental frequency w0 is: • The (stable) system’s output is: Assume a=1
Gain and Phase Transfer Function Analysis • For a complex number/function, we can represent it in polar form by calculating the magnitude (gain) and angle (phase): • H(jw) = |H(jw)|ejH(jw) • In filter/system analysis and design, we’re interested in how certain frequencies are magnified or suppressed - • These are of particular interest by plotting the system properties (amplitude/phase) against frequency: • Frequency shaping • Frequency selection • Low pass • High pass
H(jw) w 0 |H(jw)| 0 w H(jw) p/2 w -p/2 Frequency Shaping Filters • It is often necessary to change the relative magnitude of a signal at different frequencies, which is referred to as filtering. LTI systems that change the shape of the spectrum are referred to as frequency shaping filters. • Audio systems often contain frequency shaping filters (LTI systems) to change the relative amount of bass (low frequency) and treble (high frequency). Real valued and often plotted on log scaling (dB = 20log10|H(jw)|) • Complex differentiating filters are defined by • H(jw) = jw • which are useful for enhancing rapid variations in a signal. Both the magnitude and phase are plotted against frequency
H(jw) 1 0 -wc wc w H(jw) 1 0 -wc wc w Frequency Selection Filters • Frequency selection filters are specially designed to accept some frequencies and reject others. Noise in an audio recording can be removed by low pass filtering, multiple communication signals can be encoded at different frequencies and then recovered by selecting particular frequencies • Low pass filters are designed to reject/attenuate high frequency “noise” while passing on the low frequencies • High pass filters are designed to reject/attenuate low frequency signal components while passing on high frequency
R vs(t) vc(t) + - C Electrical Low Pass Filter • Differential equation for the LTI system • The frequency response transfer function H(jw) can be determined using the eigensystem property or using its impulse response definition • Magnitude-phase plot shown right • Step response: • High RC – good frequency selection • Low RC – fast time response • Inevitable time/frequency design compromise RC=1
vr(t) vs(t) R C + - Electrical High Pass Filter • Differential equation for the LTI system • The frequency response transfer function H(jw) can be determined using eigenfunction property or impulse response • Magnitude-phase plot shown right • Step response: • High RC – good frequency selection • Low RC – fast time response • Inevitable time/frequency design compromise RC=1
Summary • The system’s transfer function H(s) uniquely determines an LTI because, using convolution, it is possible to determine the output Fourier/Laplace transform, Y(s), given the input Fourier/Laplace transform X(s) • When the system is a LTI ODE, the transfer function is a rational function of s, and it can be inverted (solving the ODE) by expressing the transfer function as partial fractions • In this case, the impulse response of an ODEs is a sum of complex exponentials • Frequency response analysis, by investigating the magnitude and phase at different frequencies, is a standard method for system design • ODEs can be used to implement approximate high pass and low pass filters
Questions • Theory • SaS, O&W, Q3.15, 3.19, 3.20 • Matlab • Plot gain and phase against frequency slides 11&12 system transfer functions using the abs() and phase() Matlab functions • Simulate both the high pass and low pass systems (slides 11&12) in Simulink, when the input consists of a step signal and when it is the sum of two sinusoids of frequencies (low and high) • Simulate impulse and step responses (slides 4&5) for the first and second order systems