Download
1 / 3
80 likes | 184 Views
There are many strategies which can be traded on the basis of Bollinger bands and RSI. The Bollinger band is an indicator which gives signals when the candle crosses the Bollinger band. The RSI stands for relative strength index. In this relative strength index, the overbought and oversold levels can be easily found. The value of RSI is a number between 0 and 100. The levels of overbought and oversold market indicate the potential levels for reversals. In case of Bollinger bands, the price movements are covered by the Bollinger bands.<br><br>

E N D
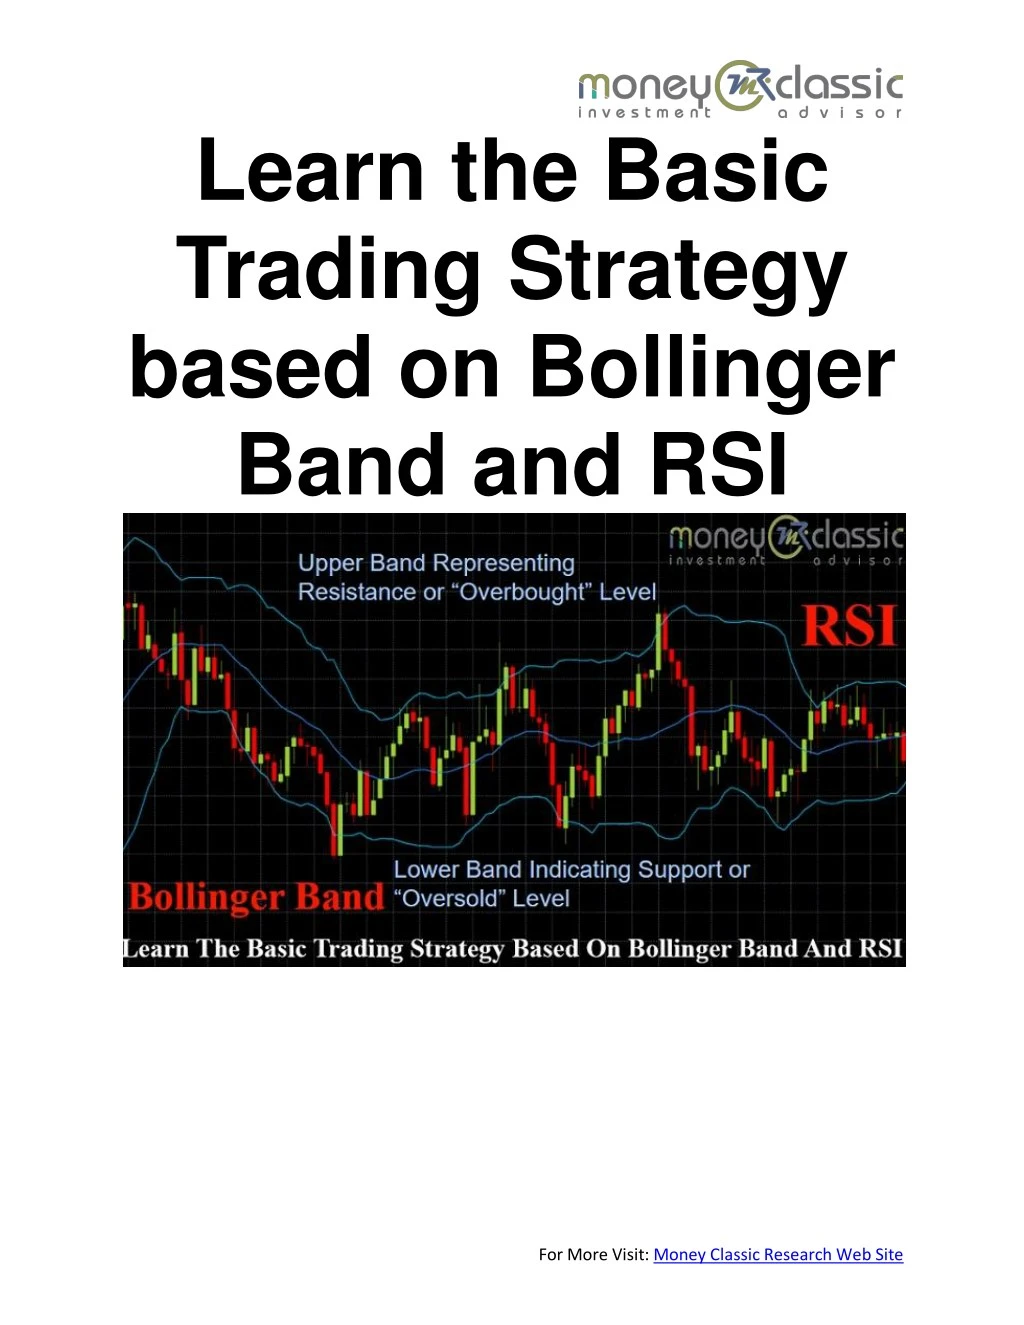
Learn the Basic Trading Strategy based on Bollinger Band and RSI For More Visit: Money Classic Research Web Site
There are many strategies which can be traded on the basis of Bollinger bands and RSI. The Bollinger band is an indicator which gives signals when the candle crosses the Bollinger band. The RSI stands for relative strength index. In this relative strength index, the overbought and oversold levels can be easily found. The value of RSI is a number between 0 and 100. The levels of overbought and oversold market indicate the potential levels for reversals. In case of Bollinger bands, the price movements are covered by the Bollinger bands. Thus if there is an overshoot from the upper band a short position can be initiated. On the other hand, if the price movements overshoot the lower band in a long position can be taken. Thus if both the Bollinger band and RSI gives the same signals of reversals the levels can be used to predict the price movements. There are other indicators which can be used besides the Bollinger bands and RSI. The indicators like MACD and moving averages can also be used in conjunction with the above- mentioned ways. While MACD stands for the moving averages convergence and divergence the moving averages are useful in the determination of the trend. At times the moving averages are used independently and at times used together with other indicators like RSI and MACD. The Bollinger band forms an envelope of the price movements. The price movements touch the envelope and again go to the mean position. Thus the breakout from the Bollinger can be taken as buy and sell signals. If the breakout is from the upper band a sell signal can be initiated. On the other hand, if the breakout occurs from the lower band, a buy signal is initiated. The signals of the buy and sell can be confirmed looking at RSI values. If the breakout is from the top band and the level of RSI is above 70, it then confirms a sell signal. On the other hand, if the breakout is from the lower band and the value of RSI is below 30, a buy trade can be initiated. The strategy discussed above should only be traded in the range bound market. In the trending market, the Bollinger band will give the false signals. For More Visit: Money Classic Research Web Site
The strategy discussed above and many other strategies are used and taught by Money Classic Research. We are a reputed financial advisory firm providing adequate advice on the market issues in the form of stock market tips. We act as a knowledge base for the financial portfolio and other investment-related issues. For More Visit: Money Classic Research Web Site