Download
1 / 41
410 likes | 825 Views
Use of LDAR II Data at WFO Fort Worth During Spring 2005. Greg Patrick NOAA/NWS Fort Worth TX. Southern Thunder Workshop July 25, 2005. Overview. WFO FWD Operations Background and Dataset Examples of LDAR II applications at WFO FWD Severe Weather Aviation

E N D
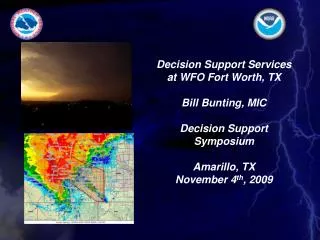
Use of LDAR II Data at WFO Fort Worth During Spring 2005 Greg Patrick NOAA/NWS Fort Worth TX Southern Thunder Workshop July 25, 2005
Overview • WFO FWD Operations • Background and Dataset • Examples of LDAR II applications at WFO FWD • Severe Weather • Aviation • Summary and Ideas for Future Work
46 Counties of Responsibility for Warnings and Forecasts Tornado, Severe Thunderstorm, Flash Flood Warnings Hazardous Weather Events – warnings, watches, advisories, statements Short Term and 7 Day public forecasts
Aviation Forecasts • Five TAF sites • Airport Weather Warnings for KDAL and KDFW (35 kts or ½” Hail) • Brief Airport Operations Personnel • Coordinate with CWSU
WSR - 88D sites used by WFO FWD • Dedicated • KFWS, KGRK • Others • KDYX, KFDR • KSHV, KEWX • KTLX
NCAR Auto-Nowcaster Project • Nic Wilson (OU – SOM) • Research Goals • Explore applications of total lightning data taken from LDAR II, specifically in the area of nowcasting • Research the effectiveness of Flash Extent Density as a representation of total lightning data and its applications toward identifying storm cells and their attributes Initiation Likelihood Field from ANC July 13, 2005
LDAR II Network and Data • 7 sensors in DFW area • VHF pulses used to reconstruct individual cloud and CG flashes in 3D • Range approx 150 km • Data file (netCDF) arrives at WFO Fort Worth every 2 min • Nine data products available for display on AWIPS • Flash Extent Density (FED) is concise integration of data
Individual sources shown as red dots... Flashes can be visualized better if you “connect the dots” in a realistic way, converting sources to branches…. Flash Extent Density
Individual sources shown as red dots... Flashes can be visualized better if you “connect the dots” in a realistic way, converting sources to branches…. Define Flash Extent Density as the number of branches/minute that pass through a grid box area… Flash Extent Density
Flash Extent Density is the number of lightning branches that pass through a specific grid box area during a specific time interval Computed after all lightning sources are grouped together into flashes FED units are Flashes km-2 min-1 Flash Extent Density
Available via Volume Browser Flash Extent Density 0-20 km Source Density Flash Initiation Point Density 0-3 km Source Density 3-6 km Source Density 6-9 km Source Density 9-12 km Source Density 12-15 km Source Density 15-18 km Source Density Available via main D2D Menu Flash Extent Density 0-20 km Source Density Gridded LDAR II Data in AWIPS
AWIPS Display of LDAR II Data Option 1: Use Volume Browser
AWIPS Display of LDAR II Data Option 2: Use D2D Main Menu - Obs
Current FWD Color Scale for LDAR II Gridded Imagery Units - Flash Products:Flashes km-2 min-1 Units - Source Products:Discharges km-2 min-1 Highest Value of FED observed ~ 30 0-20 km Source Density values can be in this range Compressed the scale used for radar imagery Customized based on values of FED observed during spring 2005
AWIPS Examples • Increase in Total Lightning Activity and Patterns in FED imagery highlight severe weather potential • April 10, 2005
FED 4 Panel 2324 UTC to 2330 UTC FED 5 VIL 53 FED 8 VIL 53 2324Z 2326Z FED 13 VIL 51 FED 15 VIL 51 2328Z 2330Z
FED 2338 UTC on 10 April 2005 FED 11 VIL 44 2338Z
FED 2340 UTC on 10 April 2005 FED 13 VIL 48 2340Z
0.5Z 2345 UTC on 10 April 2005 85 mph Tstm Gust at 2348 UTC 2345 UTC
AWIPS Examples • New updraft development on the southern flank of a supercell • April 25, 2005
FED 2114 UTC 25 April 2005 2114 UTC
FED 2116 UTC 25 April 2005 2116 UTC
FED 2118 UTC 25 April 2005 2118 UTC
4 Panel Reflectivity 2112Z 0.5 deg 600’ AGL 10.0 deg 10,000’ 19.5 deg 19,000’ 14.0 deg 14,000’
4 Panel Reflectivity 2117Z 0.5 deg 600’ AGL 10.0 deg 10,000’ 19.5 deg 19,000’ 14.0 deg 14,000’
AWIPS Examples • “Pulse” Severe Thunderstorm over Dallas County in a high CAPE and weak shear environment • July 11, 2005
FED 2206 UTC 11 July 2005 FED 5 VIL 50
FED 2210 UTC 11 July 2005 FED 15 VIL 54
FED 2222 UTC 11 July 2005 FED 12 VIL 56
FED 2230 UTC 11 July 2005 FED 15 VIL 55 G60 and ¾ in hail at 2230 UTC
FED 2240 UTC 11 July 2005 FED 20 VIL 46
FED 2252 UTC 11 July 2005 FED 6 VIL 41 Wind Damage near Mesquite 2250 UTC
AWIPS Examples • Interesting Branching and Anvil Lightning • April and May, 2005
Summary and Ideas for Future Work • FED imagery, with a 2 minute update frequency, has been used as a complement to WSR-88D imagery to help forecasters detect important storm-scale clues on convective organization • Total lightning has proven valuable in aviation forecasting, specifically with regard to the inclusion or exclusion of thunderstorms in TAFs. FED imagery helps forecasters visualize and understand the thunderstorm and CG lightning threat. • A time-integrated source density product could be developed and used to disseminate a graphical lightning hazard message. This product would be especially useful for delineating the CG threat in thunderstorm anvils and stratiform regions of MCSs. • Explore the application of Source Density and Flash Initiation Point Density products
Acknowledgements • Matt Sardi (ITO FWD) and Jason Burks (ITO HUN) accomplished the special configuration needed to allow LDAR II data to be displayed in AWIPS D2D • Nick Demetriades (Vaisala Corp) is the co-author on the conference presentation and supplied some of the images used in this presentation.