Download
1 / 37
570 likes | 1.7k Views
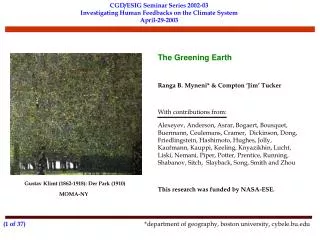
The Greening Earth. Ranga B. Myneni* & Compton ‘Jim’ Tucker. With contributions from:. Alexeyev, Anderson, Asrar, Bogaert, Bousquet, Buermann, Ceulemans, Cramer, Dickinson, Dong, Friedlingstein, Hashimoto, Hughes, Jolly, Kaufmann, Kauppi, Keeling, Knyazikhin, Lucht,

E N D
The Greening Earth Ranga B. Myneni* & Compton ‘Jim’ Tucker With contributions from: Alexeyev, Anderson, Asrar, Bogaert, Bousquet, Buermann, Ceulemans, Cramer, Dickinson, Dong, Friedlingstein, Hashimoto, Hughes, Jolly, Kaufmann, Kauppi, Keeling, Knyazikhin, Lucht, Liski, Nemani, Piper, Potter, Prentice, Running, Shabanov, Sitch, Slayback, Song, Smith and Zhou Gustav Klimt (1862-1918): Der Park (1910) This research was funded by NASA-ESE. MOMA-NY (1 of 37) *department of geography, boston university, cybele.bu.edu
publications (2 of 37) http://cybele.bu.edu/ Bogaert et al., 2002. Evidence for a persistent and extensive greening trend in Eurasia inferred from satellite vegetation index data. J. Geophys. Res., Vol. 107 (D11), 10.1029/2001JD001075. Buermann et al., 2002. Circulation anomalies explain interannual covariability in northern hemisphere temperatures and greenness. J. Geophys. Res. (accepted Dec 2002). Dong et al., 2003. Remote sensing of boreal and temperate forest woody biomass: Carbon pools, Sources and Sinks, Remote Sens. Environ. 84: 393–410. Kaufmann et al., 2000. Effect of orbital drift and sensor changes on the time series of AVHRR vegetation index data. IEEE Trans. Geosci. Remote Sens., 38: 2584-2597. Kaufmann et al., 2002. Reply to Comment on "Variations in northern vegetation activity inferred from satellite data of vegetation index during 1981- 1999" by J. R. Ahlbeck. J. Geophys. Res., Vol. 107(D11), 10.1029/2001JD001516. Lucht et al., 2002. Climatic control of the high-latitude vegetation greening trend and Pinatubo effect. Science, 296:1687-1689 (May-31-2002). Myneni, R. B., et al., 1998. Interannual variations in satellite-sensed vegetation index data from 1981 to 1991. J. Geophys. Res., 103 (D6): 6145-6160. Myneni, R. B., et al., 1997. Increased plant growth in the northern high latitudes from 1981-1991. Nature, 386:698-701. Myneni and Dong et al., 2001. A large carbon sink in the woody biomass of northern forests. Proc. Natl. Acad. Sci. USA., 98(26): 14784-14789. Nemani et al., 2003. Climate driven increases in terrestrial net primary production from 1982 to 1999. Science (in review Apr 2003). Shabanov et al., 2002. Analysis of interannual changes in northern vegetation activity observed in AVHRR data during 1981 to 1994. IEEE Trans. Geosci. Remote Sens., 40:115-130. Tucker et al., 2001. Higher northern latitude NDVI and growing season trends from 1982 to 1999. Int. J. Biometeorol., 45:184-190. Zhou et al., 2001. Variations in northern vegetation activity inferred from satellite data of vegetation index during 1981 to 1999, J. Geophys. Res., 106 (D17): 20069-20083. Zhou et al., 2002. Relation between interannual variations in satellite measures of vegetation greenness and climate between 1982 and 1999. J. Geophys. Res. 108(D1), doi:10.1029/2002JD002510.
outline (3 of 37) Background on NDVI and NDVI data sets Greening in the north - the northern latitude greening trend during the 1980s and 1990s - persistence of greening in Eurasia vs North America - the temperature connection - the connection to circulation anomalies - northern latitude greening and the forest woody biomass carbon sink The greening earth and increasing terrestrial net primary production
reflectance spectrum of a green leaf (4 of 37) Pigments in green leaves (notably chlorophyll) absorb strongly at red and blue wavelengths. Lack of such absorption at near-infrared wavelengths results in strong scatter from leaves. upper epidermis palisade layer spongy tissue lower epidermis image credit: Govaerts et al.
(5 of 37) normalized difference vegetation index, ndvi The contrast between red and near-infrared reflectance of vegetation is captured by the greenness index, NDVI, as [(nir-red)/(nir+red)]. image credit: Huete et al.
(6 of 37) avhrr ndvi data sets The Advanced Very High Resolution Radiometers, AVHRR, have been flown on NOAA polar orbiting afternoon-viewing platforms NOAA-07: jul 81 to jan 85 NOAA-09: feb 85 to oct 88 NOAA-11: nov 88 to sep 94 NOAA-14: jan 85 to oct 01. GIMMS and PAL NDVI Data Sets Have Calibration Partial Atmospheric Correction Corrections for Stratospheric Aerosols 10 or 15-day Maximum Value Composites Run from July 1981 to about mid-2001 GIMMS: GLOBAL INVENTORY MONITORING AND MODELING SYSTEMS PAL: PATHFINDER AVHRR LAND
outline (7 of 37) Background on NDVI and NDVI data sets Use with caution - download from http://cybele.bu.edu/ Greening in the north - the northern latitude greening trend during the 1980s and 1990s - persistence of greening in Eurasia vs North America - the temperature connection - the connection to circulation anomalies - northern latitude greening and the forest woody biomass carbon sink The greening earth and increasing terrestrial net primary production
(8 of 37) greening trend in the north delayed fall earlier spring Jan Jul Aug Dec Jan Jul Aug Dec In the north, where vegetation growth is seasonal, the cumulative growing season greenness, which is the area under the NDVI curve, can change either due to a longer photosynthetically active growing season or due to increased greenness magnitude, or both. 1) Define vegetated pixels in the study area using a land cover map 2) Use NDVI values greater than zero only to avoid sparsely vegetated areas, pixels with snow and any corrupted data changes in growing season duration changes in greenness magnitude Increase 4) Use NDVI threshold to assess changes in dates of spring green-up and autumn green- down (assess sensitivity to threshold value) 3) Assess changes in peak seasonal greenness from July and August average NDVI
greening trend in the north (1980s & 90s) (9 of 37) Analysis of GIMMS (v1) ndvi data for the period 1981 to 1999 indicate that: A larger increase in growing season NDVI magnitude (12 vs 8%) and a longer active growing season (18 vs 12 days) brought about by an early spring and delayed autumn are observed in Eurasia relative to North America 8.4%/18 yrs (p<0.05) 11.9 days/18 yrs (p<0.05) 17.5 days/18 yrs (p<0.05) 12.4%/18 yrs (p<0.05) • NDVI averaged over boreal growing season months of May to September increased by about 10%, • the timing of spring green-up advanced by about 6 days. • NDVI averaged over boreal growing season months of May to September increased by about 10%, • the timing of spring green-up advanced by about 6 days. From Zhou et al., (JGR, 106(D17):20069-20083, 2001)
outline (10 of 37) Background on NDVI and NDVI data sets Use with caution – download from http://cybele.bu.edu Greening in the north - the northern latitude greening trend during the 1980s and 1990s the northern latitudes (>40N) have greened since the early 1980s - persistence of greening in Eurasia vs North America - the temperature connection - the connection to circulation anomalies - northern latitude greening and the forest woody biomass carbon sink The greening earth and increasing terrestrial net primary production
spatial pattern of greening (11 of 37) Analyses of pixel-based persistence indices from GIMMS (v1) NDVI data for the period 1981 to 1999 indicate that: About 61% of the total vegetated area between 40N-70N in Eurasia shows a persistent increase in growing season NDVI over a broad contiguous swath of land from Central Europe through Siberia to the Aldan plateau, where almost 58% (7.3 million km2) is forests and woodlands. North America, in comparison, shows a fragmented pattern of change, notable only in the forests of the southeast and grasslands of the upper Midwest. These results are further substantiated from a study that evaluated patch characteristics using landscape ecology metrics (Bogaert et al., JGR, 107(D11):10.1029/2001jd001075, 2002). From Zhou et al., (JGR, 106(D17):20069-20083, 2001)
outline (12 of 37) Background on NDVI and NDVI data sets Use with caution – download from http://cybele.bu.edu Greening in the north - the northern latitude greening trend during the 1980s and 1990s the northern latitudes (>40N) have greened since the early 1980s - persistence of greening in Eurasia vs North America the greening in Eurasia is more persistent than in North America - the temperature connection - the connection to circulation anomalies - northern latitude greening and the forest woody biomass carbon sink The greening earth and increasing terrestrial net primary production
greenness and surface temperature (13 of 37) The temporal changes and continental differences in NDVI are consistent with ground based measurements of temperature, an important determinant of biological activity in the north T – GISS temperature; EA – Eurasia; NA - North America From Zhou et al., (JGR, 106(D17):20069-20083, 2001)
(14 of 37) modeling the temperature connection The observed trend toward earlier spring budburst and increased maximum leaf area is produced by the model as a consequence of biogeochemical vegetation responses mainly to changes in temperature. A biogeochemical model of vegetation using observed climate data predicted the high northern latitude greening trend over the past two decades observed by satellites and a marked setback in this trend after the Mount Pinatubo volcano eruption in 1991. From Lucht et al., (Science, 296:1687-1689, 2002)
outline (15 of 37) Background on NDVI and NDVI data sets Use with caution – download from http://cybele.bu.edu Greening in the north - the northern latitude greening trend during the 1980s and 1990s the northern latitudes (>40N) have greened since the early 1980s - persistence of greening in Eurasia vs North America the greening in Eurasia is more persistent than in North America - the temperature connection it is temperature, not co2, that is the related to greening - the connection to circulation anomalies - northern latitude greening and the forest woody biomass carbon sink The greening earth and increasing terrestrial net primary production
(16 of 37) cca analysis what is causing these correlations? are these relations valid at finer (pixel) scales? Zhou et al., (2001) Data NDVI data: FASIR GIMMS v1 (1982-98) (Courtesy of Los et al.) Surface temperature from GISS (Hansen et al., 1999) NINO3 index (Reynolds and Smith, 1994) AO index (first EOF of NH SLP 20N-90N; Thompson and Wallace, 1998) Method Canonical Correlation Analysis (CCA) to isolate coupled spatial patterns between temperature and NDVI and assess their possible relationship to large-scale circulation anomalies From Buermann and Anderson et al. (JGR, in press)
(17 of 37) the enso mode Geographic Plot of the Grid-point Correlations for the 1st CF TEMPERATURE Spring (MAM) Temp and Spring NDVI, 10N-90N First canonical factor: the ENSO signal Temperature (r=0.78) NDVI (r=0.76) NINO3 SON (81-97) NDVI Principal Component These figures indicate that the first factor captures the NH spring ENSO tele- connection signal in the surface temperature and NDVI fields. During warm ENSO events, warmer and greener conditions prevail in spring over North America, far east Asia and to some extent over Europe. The ENSO related patterns explain 10.8% (13.5%) of the total spring surface temperature (NDVI) variability.
(18 of 37) the ao mode Geographic Plot of the Grid-point Correlations for the 2nd CF TEMPERATURE Spring (MAM) Temp and Spring NDVI, 10N-90N Second canonical factor: the AO signal Temperature (r=0.85) NDVI (r=0.83) Principal Component NDVI AO (DJB), 82-98 NAO (DJF), 82-98 These figures indicate that the first factor captures the NH spring AO teleconnection signal in the surface temperature and NDVI fields. The fact that there is quantitative agreement between the temporal and spatial features isolated via the CCA algorithm and those associated with ENSO and AO indices suggests that surface temperature signatures associated with these two predominant modes of global climate variability are also important drivers for variability in northern hemisphere greenness.
outline (19 of 37) Background on NDVI and NDVI data sets Use with caution – download from http://cybele.bu.edu Greening in the north - the northern latitude greening trend during the 1980s and 1990s the northern latitudes (>40N) have greened since the early 1980s - persistence of greening in Eurasia vs North America the greening in Eurasia is more persistent than in North America - the temperature connection it is temperature, not co2, that is the related to greening - the connection to circulation anomalies ENSO and AO are partly responsible for the correlation between temperature and NDVI - northern latitude greening and the forest woody biomass carbon sink The greening earth and increasing terrestrial net primary production
(20 of 37) biomass carbon stocks, sources and sinks Motivation About 1 to 2 giga (10^9) tons of carbon (Gt C) a year are suggested to be sequestered in pools on northern land. Debate is currently underway regarding which of the forest biomass sinks can be used by the industrialized nations to meet their commitments under the Kyoto protocol. This study is limited to analysis of the carbon pool in the woody biomass of northern temperate and boreal forests, which cover an area of about 1.4 to 1.5 billion hectares. We define forests as the following remote sensing land covers: broad leaf forests, needle leaf forests, mixed forests and woody savannas. From Myneni and Dong et al. (PNAS, 98(26):14784-14789, 2001)
(21 of 37) inventory data and greenness Year-to-year changes in biomass are quite small, about two orders of magnitude smaller than the biomass pool. At decadal and longer time scales, the biomass changes can be considerable due to accrual of the differences between gains and losses. Potentially, these can be observed as low frequency variations in decadal scale greenness, in much the same way as century scale greenness changes are suggestive of successional changes. Forest inventory data from 171 provinces in six countries that represent a wide variety of inventory practices, provincial forest area, ecosystem types, age structures and time periods. We use 5-yr averages of growing season NDVI total (GIMMS v1), the area under seasonal NDVI curve and above a threshold, which captures both the average seasonal level of greenness and growing season duration, and therefore is an ideal measure of seasonal greenness.
(22 of 37) uncertainty analysis The relation between woody biomass and seasonal greenness is estimated as, 1/biomass = a + [(1/ndvi)/latitude^2] + g latitude where, biomass: inventory estimate (tons/ha), ndvi: cumulative growing season ndvi averaged over five years of the inventory, latitude: average of latitudes over forest pixels in each province and, , and : regression coefficients The relative difference between remote sensing and inventory estimates is 27% for above-stump biomass (10.4 tons C/ha), 33% for total biomass (16.1 tons C/ha), 50% for changes in pool size (0.33 tons C/ha/yr)
(23 of 37) spatial picture of the biomass sink Pool changes were then evaluated as the difference between the late 1990s and early 1980s pool estimates, pixel-by-pixel, and quoted on a per year basis. The carbon pool in the woody biomass of northern forests (1.5 billion ha) is estimated to be 61 20 Gt C during the late 1990s. Our sink estimate for the woody biomass during the 1980s and 1990s is 0.680.34 Gt C/yr.
(24 of 37) country analysis The estimates of the three large countries, Canada, Russia and the USA, are crucial because they account for 78% of the pool, 73% of the sink and 77% of the forest area. For Canada, we estimate a sink of about 73 Mt C/yr which is comparable to an inventory estimate by the Canadian forest service about 85 Mt C/yr.
(25 of 37) country analysis Our pool, sink and forest area estimates for the USA are are comparable to TBFRA-2000 estimates. Our sink estimate for the USA (142 Mt C/yr) is comparable to most estimates for the 1980s (110 to 150 Mt C/yr).
(26 of 37) country analysis Estimates for Russia differ principally because of differences in the definition of forest area. When expressed on a per unit forest area basis, the various estimates are comparable.
(27 of 37) reasons The spatial patterns, however, offer some clues: a) longer growing seasons from warming in the northern latitudes possibly explain some of the changes, and c) fire suppression and forest re-growth in the USA d) declining harvests in Russia b) increased incidences of fires and infestations in Canada f) forest expansion and re-growth in China e) improved silviculture in Nordic and European countries
(28 of 37) outline Background on NDVI and NDVI data sets Use with caution – download from http://cybele.bu.edu Greening in the north - the northern latitude greening trend during the 1980s and 1990s the northern latitudes (>40N) have greened since the early 1980s - persistence of greening in Eurasia vs North America the greening in Eurasia is more persistent than in North America - the temperature connection it is temperature, not co2, that is the related to greening - the connection to circulation anomalies ENSO and AO are partly responsible for the correlation between temperature and NDVI - northern latitude greening and the forest woody biomass carbon sink biomass carbon sinks represent 10% of the annual fossil fuel emissions The greening earth and increasing terrestrial net primary production
(29 of 37) motivation Global environmental changes between 1980 and 2000 have been significant: - Two of the warmest decades in the instrumental record - Three intense El Nino events (1982-83; 1987-88; 1997-98) - Changes in tropical cloudiness and monsoon dynamics - A 9.3% increase in atmospheric co2 concentration - A 36% increase in global population (4.45 billion in 1980 to 6.08 billion in 2000) Image credit: IPCC A substantial incentive to understand trends and variability in terrestrial Net Primary Production because NPP: - is the foundation of food, fiber and fuel for human consumption - determines seasonal and interannual variations in atmospheric co2 - integrates climatic, ecological, geochemical and human influences on the biosphere Image credit: FAO How have global environmental changes affected (eased or strengthened) climatic constraints to plant growth and NPP? From Nemani et al., (Science; in review, 2003)
(30 of 37) step 1: limiting factors Plant growth is assumed to be principally limited by sub-optimal climatic conditions such as low temperatures, inadequate rainfall and cloudiness (Churkina and Running, 1998). We used 1960-1990 average climate data (Leemans and Cramer, 1991) to develop scaling factors between 0 and 1 that indicate the reduction in growth potential. Dominant Controls water availability 40% temperature 33% solar radiation 27% Total vegetated area: 117 M km2
(31 of 37) step 2: trends in climate data Data: Reanalysis data (6-hourly 2 m height temperatures, 2-m height specific humidity, and incident solar radiation) from NCEP to represent climate variability from 1982 to 1999. The observed climatic changes have been mostly in the direction of reducing climatic constraints to plant growth. Therefore, it seems likely that vegetation responded to such changes positively. Potential Climate Limits for Plant Growth Interannual trends in daily average temperature 1982-99 Interannual trend in vapor pressure deficit 1982-99 Interannual trend in solar radiation 1982-99
(32 of 37) step 3: npp evaluation The NPP Algorithm Step 1 convert absorbed radiation to optimal gross production Step 2 downgrade by climate limiting factors to obtain gpp Step 3 subtract respiration to obtain npp Trends in NPP are positive over 55% of the global vegetated area and are statistically more significant than the declining trends observed over 19% of the vegetated area. Average of interannual trends (1982-99) in growing season NPP estimated with GIMMS and PAL (v3) FPAR
(33 of 37) climate, npp and atmospheric co2 growth rate Interannual variations in global NPP are correlated with global atmospheric CO2 growth rates (r = 0.70, p<0.001). NPP declined during all three El Niño events. Analyses of variation in the plant photosynthesis- respiration balance, expressed as NPP/GPP ratio (right panel), showed observed declines in NPP during El Niño years to be dominated by increases in respiration due to warmer temperatures. Although the atmospheric co2 growth rate depends on the net air-sea and land-atmosphere exchanges, these results highlight the preeminent role of plant growth in global carbon cycle.
(34 of 37) npp trends by latitude Ecosystems in all tropical regions and those in the high latitudes of the Northern Hemisphere accounted for 80% of the increase in global NPP between 1982 and 1999. El Niño impacts are strong at low latitudes when compared to mid- and high latitudes. A strong decline in NPP following the Mt. Pinatubo eruption (1991) was evident only at the high latitudes of the Northern Hemisphere. Cooler temperatures resulting from the eruption decreased the growing season length at high latitude. The same cooling may have promoted plant growth in low latitude ecosystems by reducing the evaporative demand and respiration losses.
(35 of 37) npp trends in the tropics The evergreen forests of the Amazon region showed NPP increases, on average, of >1.0% / yr, contributing to over 40% of the global NPP increases between 1982 and 1999. An increase in NPP of <0.22% per ppm increase in CO2, within the range of experimental evidence, could be invoked to explain all of the estimated global NPP increase of 6.17% / 18yr. NPP increases of >1%/yr as in the case of Amazonia require a fertilization effect greater than 0.5% per ppm of CO2 increase, which appears to be much greater than those reported by field experiments. We suggest increases in solar radiation, as a result of declining cloud cover, in these predominantly radiation-limited forests as a plausible explanation for the increased NPP.
(36 of 37) outline Background on NDVI and NDVI data sets Use with caution – download from http://cybele.bu.edu Greening in the north - the northern latitude greening trend during the 1980s and 1990s the northern latitudes (>40N) have greened since the early 1980s - persistence of greening in Eurasia vs North America the greening in Eurasia is more persistent than in North America - the temperature connection it is temperature, not co2, that is the related to greening - the connection to circulation anomalies ENSO and AO are partly responsible for the correlation between temperature and NDVI - northern latitude greening and the forest woody biomass carbon sink biomass carbon sinks represent 10% of the annual fossil fuel emissions The greening earth and increasing terrestrial net primary production Tropical and northern ecosystems drive increases in terrestrial npp as a result of easing of climatic limits to plant growth
(37 of 37) bottomline Since the early 1980s about, • half the vegetated lands greened by about • 11% • 15% of the vegetated lands browned by • about 3% • 1/3rd of the vegetated lands showed no • changes. These changes are due to easing of climatic constraints to plant growth. The End