Download
1 / 43
430 likes | 759 Views
Multiple Indicator Cluster Surveys- MICS3 Analysis and Report Writing Workshop Panama City, July 12-20, 2006. Infant and Child Mortality. Indicators’ Definition. Under-five mortality rate Probability of dying by exact age 5 years Infant mortality rate Probability of dying by exact age 1 year.

E N D
Multiple Indicator Cluster Surveys- MICS3 Analysis and Report Writing Workshop Panama City, July 12-20, 2006 Infant and Child Mortality
Indicators’ Definition • Under-five mortality rateProbability of dying by exact age 5 years • Infant mortality rateProbability of dying by exact age 1 year
Goals • World Submit for Children (WSC) • Between 1990 and the year 2000, reduction of infant and under-five child mortality rate by one third or to 50 and 70 per 1000 live births respectively, whichever is less • Millennium Development Goals (MDGs) • Reduce by two-thirds, between 1990 and 2015, under-five mortality • Indicator 13 – Under-5 Mortality Rate • Indicator 14 – Infant Mortality Rate
Why to measure child mortality • Reasons: • 5q0 is a broad indicator of social development/health status • to evaluate impact of interventions based on trends
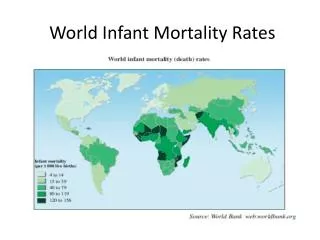
Data sources/methods • Vital registration • Population census • Longitudinal or prospective sample surveys • Household surveys • Data from birth histories as from DHS • Data to use “Brass methods” as from MICS3
Which countries included this module in MICS3? • 6 out of 7 • Belize, Dominican Republic, Guyana, Jamaica, Suriname and Trinidad and Tobago • Cuba did not • Mongolia?
Which is the approach in MICS3? • Indirect estimation using the Brass method to derive values for U5MR and IMR • Use other existing estimates and compare along time to produce trends along time • Report within the existing context and limitations
The “Brass” approach • Data needed • Number of women by age (5 years) • Number of children ever born • Number of children dead/alive (surviving) • Selection bias • Uses data for surviving mothers only • May be greater in countries affected by HIV/AIDS (prevalence of 5% or more)
Characteristics of the “Brass” method • Questions are short and simple • Provide acceptable mortality estimates over a period of 10 years and more • Does not provide estimates for: • the age patterns of child mortality • causes of death
The “Brass” equation • Brass was the first to develop a procedure for converting proportion dead of children ever born (D(i)) reported by women in age groups 15-19, 20-24, etc. into estimates of probability of dying before attaining certain exact childhood ages, q(x): • q(x) = K(i)*D(i) • where the multiplier K(i) is meant to adjust for non mortality factors determining the value of D(i)
What does the “Brass” method do? • Brass found that the relation between the proportion of children dead D(i), and a life-table mortality measure, q(x), is primarily influenced by the age pattern of fertility, because it is this pattern that determines the distribution of the children of a group of women by length of exposure to the risk of dying • Brass developed a set of multipliers to convert observed values of D(i) into estimates of q(x), the multipliers being selected according to the value of P(1)/P(2), where P(i) is the average parity or number of children ever born reported by women in the age group i • Brass used a third-degree polynomial of fixed shape
What does the “Brass” method do? • Brass estimated the k(i) multipliers by using • a third-degree polynomial of fixed shape but variable age location to represent fertility, • The logit system generated by the general standard to provide the mortality element, and • A growth rate of 2% per annum to generate a stable age distributions for females
Modifications of the “Brass” method • Sullivan computed another set of multipliers using LSR to fit the equation to data generated from observed fertility schedules and the Coale-Demeny life tables • Trussel estimates a third set of multipliers by the same means but using data generated from the model fertility schedules developed by Coale and Trusell. • Feeney developed an estimation procedure to establish the set of years to which infant mortality estimated from data on children ever born and children surviving refer
Assumptions of the “Brass” method • A constant patterns and level of mortality have prevailed in the recent past • Fertility has been roughly constant in the recent past • Child mortality has been changing in a linear way in the recent past
Model age patterns of child mortality • Similar across human populations • Model life-tables. Single parameter (level) for different age patterns • Coale-Demeny patterns by region: • East, North, South, and West • United Nations patterns by region: • Latin America, Chilean, South Asian, Far Eastern, and General
Choice of inappropriate age pattern of mortality results in... • A misestimation of trends • However, the 5q0 estimate obtained from women 30-34 and referred to about 6 years before the survey is little affected.
The Age Pattern of Mortality in Childhood • How to select a mortality pattern? • Independent information • Successive data sets • Geographical proximity • The WEST model appears to be the more common age pattern of mortality in the region
The Age Pattern of Mortality in Childhood • How to select a mortality pattern? • Independent information • Successive data sets • Geographical proximity • Graphic interpolation
Mortality pattern in the LAC countries • CountryLife table model • Belize West (East?) • Dominican Republic West • Guyana West (South?) • Jamaica West • Suriname West • Trinidad and Tobago East (West?) • Mongolia West
Methodology for calculation • SPSS program to produce tables for preliminary and final MICS3 reports • MORTPAK program to produce estimates when data set is not available but basic data can be used
SPSS Program • Generates basic tables (CM.1A) • Generates IMR and U5MR total and by background variables (CM.2) • The program assumes: • Definition of a pattern from the Coale and Demeny families (i.e. East, West, North, or South) • Definition of age groups used to produce the mortality estimates included in table 8 (20-24, 25-29, 30-34) • These choices have to be done before running the SPSS program
Disaggregation of estimates by background variables • Use dichotomous variables as much as possible: boys/girls, urban/rural, mothers with education/without education, poorest 60%/richest 40%, etc.) • No more than 4 groups for region and ethnic group • Beware of sampling errors when reporting current differences or trends
Issues for Discussion • Disaggregation of estimates by background variables • Use dichotomous variables (poorest 60%/richest 40%, etc.) • Beware of sampling errors • Differences between household survey estimates and those from administrative records and vital registration • Current estimates produced by the inter-agency mortality estimation group
Are we measuring the same? • Existing research indicates that: • There are evidences of mis-reporting and/or omission of deaths • Measurement errors
The inter-agency mortality estimation group • Sponsored at the global level by UNICEF, WHO, the WB, the UNPD • Produces country estimates of U5MR and IMR and trends from all available values • Estimates are obtained by a regression model fitted to all available values • Estimates are yearly presented as part of the agencies’ yearly publication and as part of the MDG report
MORTPAK • Package developed by the UN Statistics/Population(?) Division • Includes many modules • Mortality estimation via the Brass approach is one of the modules • Requires inputs and decisions from user: • Values for year and month of survey, and sex • Selection of region fro C & D patterns • Analysis of results and decision on age groups to be used (20-24, 25-29, 30-34 or averages)